Figures & data
Figure 1. Schematic representation of the affect processing task comprising scenes depicting social rejection, acceptance and neutral interactions.
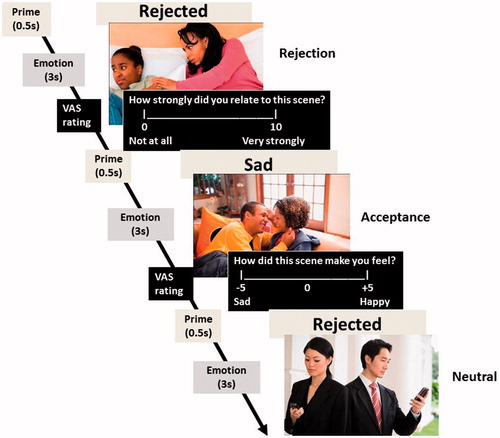
Figure 2. Plot of the grand average waveform at midline frontal, midline parietal and right temporo-parietal sites from 200 ms pre-stimulus to 1-s post-stimulus during the affect processing task. The blue solid line depicts the waveform for rejection, red dotted line depicts the waveform for acceptance, and the green broken line depicts the waveform for neutral scenes.
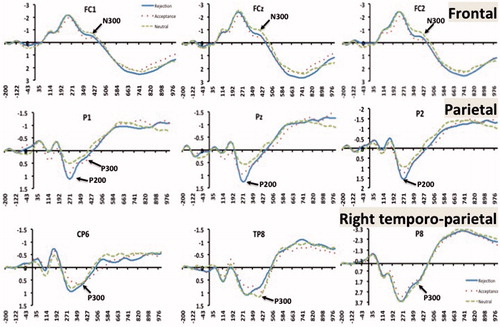
Figure 3. (a) Plot of the rescaled configuration matrix loadings of the nine temporal PCA factors from 200 ms pre-stimulus baseline to 1-s post-stimulus onset during the affect processing task, and (b) the scalp-level maps of the spatial scores of temporal factor 9 (P200) and 2 (N300/P300). Only positive values (depicted in red in Figure 3b) denote the intensity of spatial mapping, since the scalp maps are based on matrix loadings.
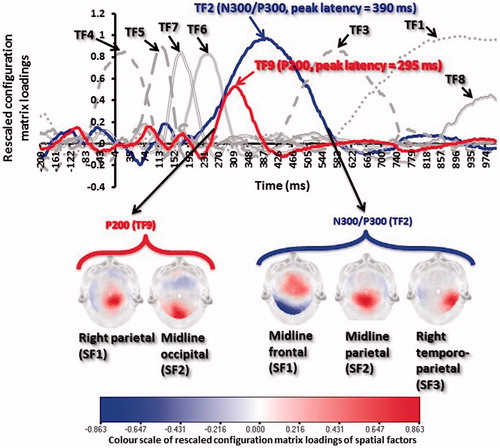
Figure 4. Cortical source current density difference map depicting greater dorsal anterior cingulate P200 activation during rejection than neutral scenes.
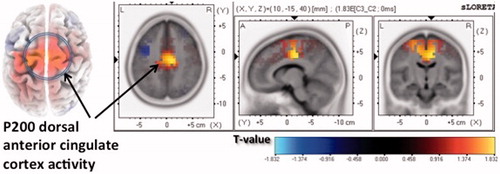
Figure 5. Correlation between negative schizotypy and right middle occipital gyrus P200 current density (MNI co-ordinates 30, –80, 15) during rejection scenes.
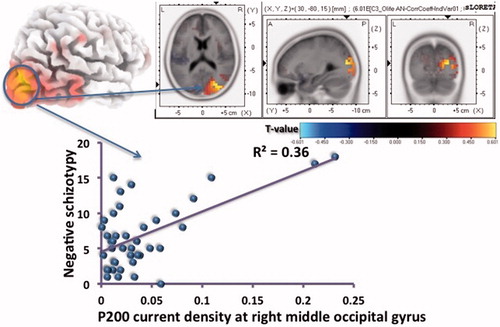
Table I. Regression of P200/P300 amplitude during rejection scenes on schizotypy.
Table II. Hierarchical regression of schizotypy and neuroticism on P200/P300 activation during rejection scenes.
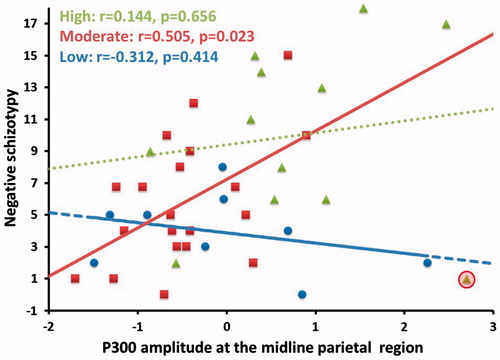
Figure 6. Scatterplot of midline parietal P300 amplitude during rejection scenes and negative schizotypy scores according to high, moderate and low neuroticism groups. The green dotted line represents the high neuroticism group, the red solid line represents the moderate neuroticism group, and the blue broken line represents the low neuroticism group. The circled data point indicates an outlier in the high neuroticism group.