Figures & data
Table I. Characteristics of the applied 198Au NP suspensions.
Table II. Characteristics of the applied gold NPs.
Table III. NP content in the gastro-intestinal tract (GIT).
Figure 1. NP content which reached the circulation after intra-oesophageal application in % of administered particle-amount. Given is the mean ± standard error of the mean of four animals.
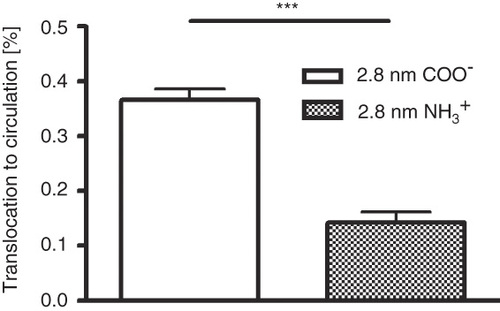
Figure 2. NP content which accumulated in secondary organs, the remainder, as well as the urine after intra-oesophageal application in % of administered particle-amount. Given is the mean ± standard error of the mean of four animals. *p < 0.05; ***p < 0.001; nd, not detected.
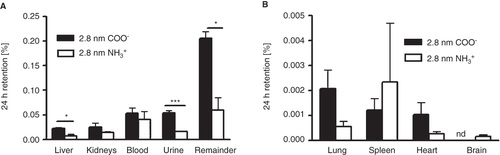
Figure 3. NP content which reached the circulation after intra-oesophageal application in % of administered particle-amount. Given is the mean ± standard error of the mean of four animals.
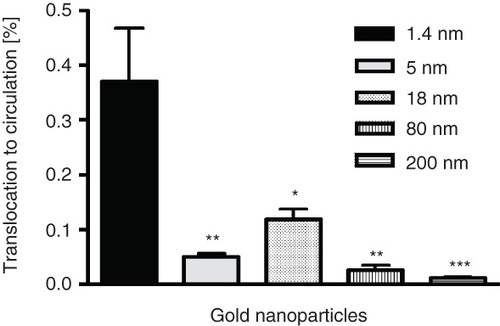
Figure 4. NP content which accumulated the blood (A), reticulo endothelial system (RES; liver plus spleen), (B), kidney (C), as well as urine (D) after intra-oesophageal application in % of administered particle-amount. Given is the mean ± standard error of the mean of four animals.
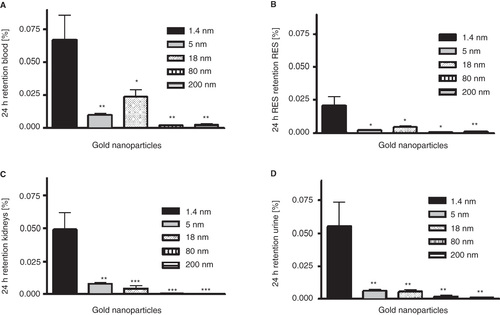
Figure 5. NP content which accumulated the heart (A), and brain (B) after intra-oesophageal application in % of administered particle-amount. Given is the mean ± standard error of the mean of four animals.
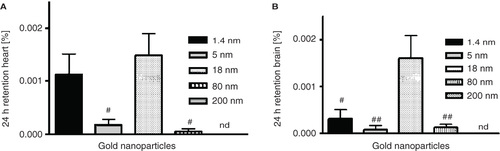
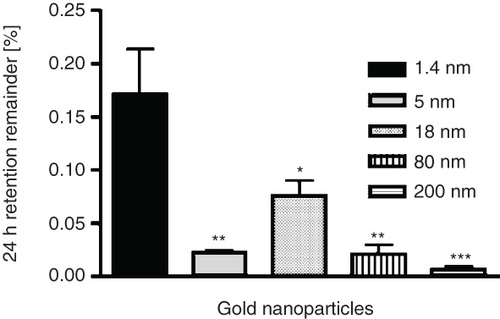
Figure 6. NP content which accumulated in the remaining carcass after intra-oesophageal application in % of administered particle-amount. Given is the mean ± standard error of the mean of four animals.