Figures & data
Table I. Specifications of cadmium telluride quantum dots (CdTe-QDs) provided by the commercial sources.
Figure 1. A. Fluorescence spectra for QD-1 and QD-2 at 450 nm excitation and emission wavelengths from 500 to 580 nm. B. Standard curves for QD-1 and QD-2 at 485 nm excitation and 540 nm emission. The standard curves for both QDs were plotted using linear curve fit (y = A + Bx) with A = 21.056, B = 43.995 and R2 = 0.997 for QD-1 and A = 41.031, B = 47.283 and R2 = 0.998 for QD-2.
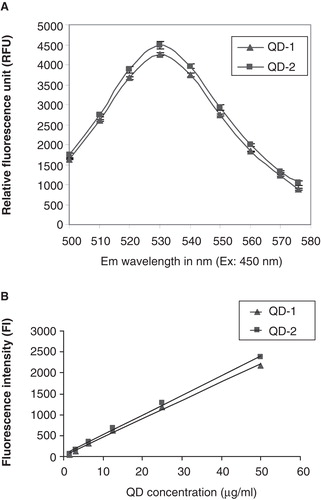
Figure 2. Analysis cadmium telluride quantum dots (CdTe-QDs) by atomic force microscopy (AFM) and transmission electron microscopy (TEM). (A) AFM image of full commercial concentration of CdTe-QD deposited on freshly cleaved mica. The samples were also diluted to 20 μg/ml and deposited onto cleaved mica for AFM and formvar-coated copper grids for TEM. (B) Summary of Z-dimension size measurements of diluted CdTe-QDs as measured by AFM. (C) TEM image of diluted CdTe-QDs. (D) The diameter of each individual CdTe-QDs was measured at its minimum and maximum dimensions. These measurements were used to estimate the average aspect ration as a measure of sphericity, where 1 is an ideal circle.
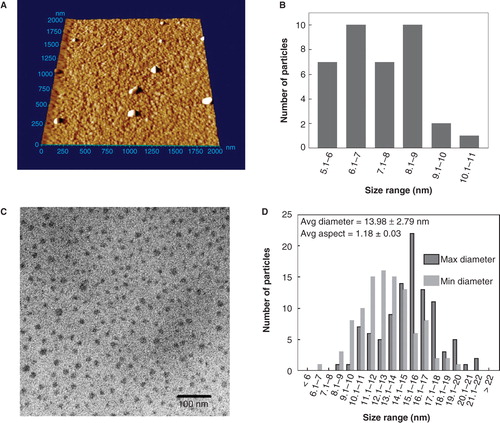
Figure 3. Cytotoxicity as assessed by loss of metabolic activity (bioreduction) of QD-treated cultures relative to PBS-treated controls. J774A.1 macrophages (A, B) and HT29 epithelial cells (C, D) were exposed to QD-1 (A, C) or QD-2 (B, D), and bioreduction was quantified using the MTT assay. The asterisks (*) indicate statistically significant differences compared with PBS-treated control (p < 0.001). Below 10-2 µg/ml, no change in bioreduction was detected.
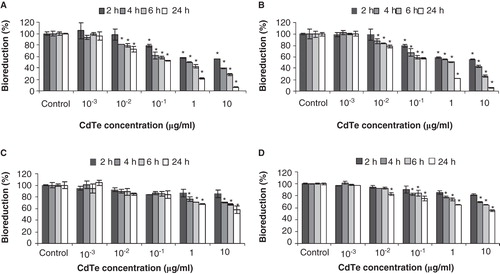
Figure 4. Fluorescence confocal micrographs of J774A.1 macrophages and HT29 epithelial cells treated with QD-1 compared with controls. The cells were stained for F-actin (pink) and the nucleus (blue). Arrows point to the presence of green CdTe. (A) Control J774A.1, (B) J774A.1 cells treated with 10-2 µg/ml QD-1 for 1 h, (C) J774A.1 cells treated with 10 µg/ml QD-1 for 4 h, (D) control HT29, (E) HT29 cells treated with 10-2 µg/ml for 4 h and (F) HT29 cells treated with 10 μg/ml QD-1 for 24 h. Similar results were obtained for QD-2.
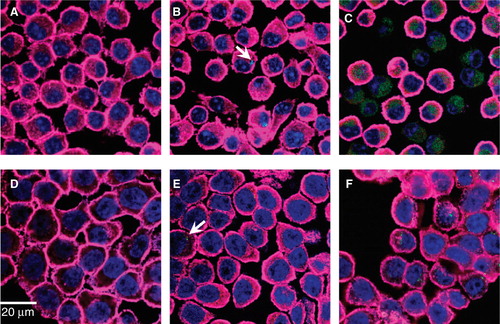
Figure 5. The effect of cadmium telluride quantum dots (CdTe-QDs) on PA01 cytotoxicity activity. J774A.1 macrophages (A) and HT29 epithelial cells (B) were exposed to QD-1 and then PA01 (107 bacteria/ml). Bioreduction activity of 6 h-treated cultures was measured and is shown relative to controls. CdTe-QD concentrations from 10-7 to 10-3 µg/ml alone did not cause observed cytotoxicity, but caused a greater loss of bioreduction for each cell type when being subsequently exposed to PA01, compared with treatment of PA01 alone. Asterisks (*) and (**) indicate statistically significant differences compared with control with p < 0.001 and with p < 0.05, respectively.
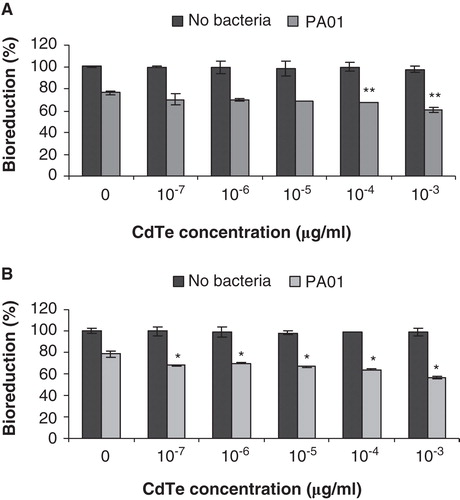
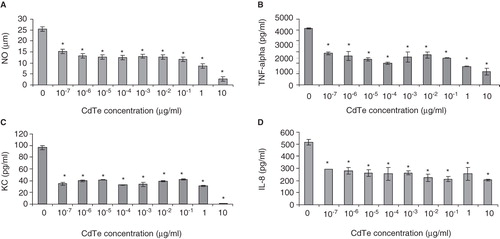
Figure 6. Effects of cadmium telluride quantum dots (CdTe-QDs) on the production of inflammatory mediators from J774A.1 macrophages and HT29 epithelial cells. Test cells were treated with different concentrations of QD-1 for 4 h. (A) Levels of nitric oxide from J774A.1. (B) Levels of IL-1β, IL-6, RANTES and TNF-α from J774A.1. (C) Levels of KC/CXCL-1 from J774A.1. (D) Levels of IL-8 from HT29.
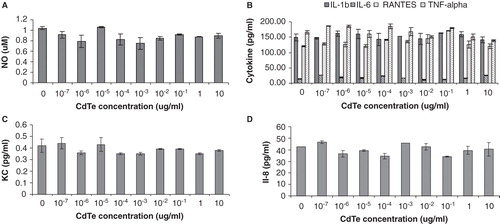
Figure 7. Effect of cadmium telluride quantum dots (CdTe-QDs) on production of immune mediators from J774A.1 and HT29 in response to PA01. Cells were pretreated with different concentrations of QD-1 for 4 h, excess QDs were washed out and cells were then exposed to PA01 for 4 h. Gentamicin was present in all exposures. Levels of NO (A), TNF-α (B), KC (C) from J774A.1 and IL-8 (D) from HT29 were measured as described in the Materials and Methods. Asterisks (*) indicate statistically significant differences compared with control (p < 0.001).