Figures & data
Figure 1. TEM micrographs of the pristine forms of the four different ZnO particles: A) ZnO, B) nZnO-1, C) nZnO-2 and D) nZnO-3. Scale bars are 100 nm for A, B and C, and 50 nm for D.
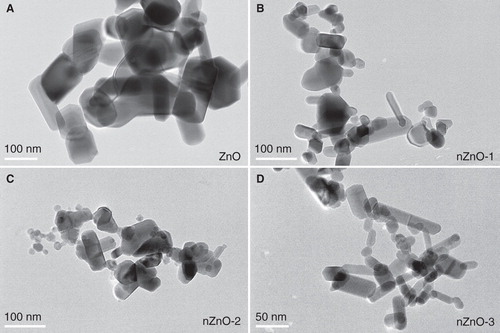
Figure 2. Frequency distribution of particle sizes (ferret diameter) derived from TEM micrographs of the pristine ZnO particles.
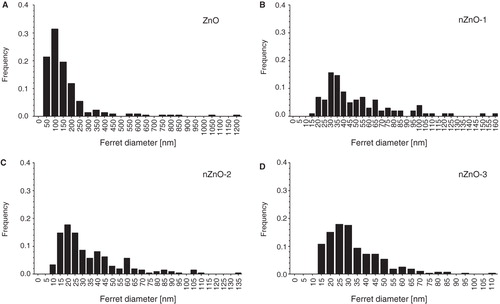
Figure 3. TEM images of ZnO particles after incubation in different cell culture media: A, B, C and D) ZnO, nZnO-1, nZnO-2 and nZnO-3 incubated for 24 h in α-MEM, respectively; E, F, G and H) ZnO, nZnO-1, nZnO-2 and nZnO-3 incubated for 24 h in EMEM, respectively. The white circle in E) marks the particle, which was exemplarily analysed by EDX spectroscopy (cf. ). The scale bars are 200 nm for A, B and F, 100 nm for C, E and G and 50 nm for D and H.
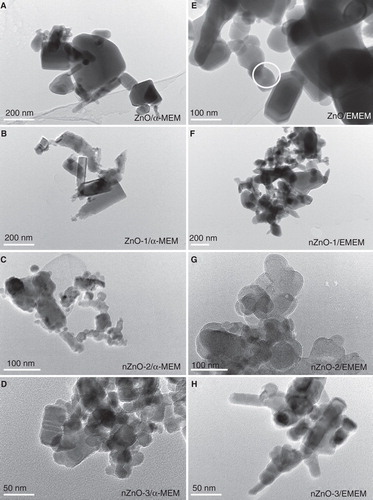
Figure 4. EDX spectrum of the surface of a ZnO particle incubated for 24 h in cell culture medium (cf. , white circle).
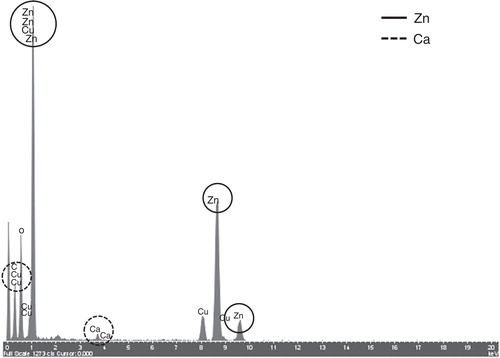
Table I. Particle sizes (nm) measured by DLS in EMEM and α-MEM media immediately after preparation and 24 h after incubation under the respective culture conditions.
Figure 5. DLS size distribution profile of the supernatants obtained by centrifugation (1000 rpm for 10 min) of the ZnO particle suspensions prepared in EMEM and α-MEM medium (100 µg/ml) incubated for 24 h at 37 and 30°C, respectively.
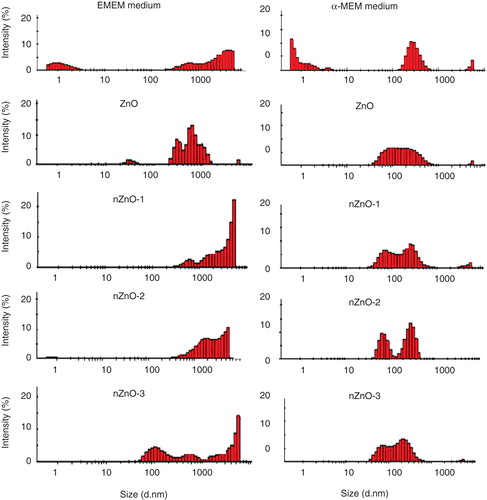
Table II. Measured concentrations of total Zn by ICP-MS expressed as µg ZnO per ml.
Figure 6. Cytotoxicity of ZnO particles suspensions and supernatants in PLHC-1 and Hep G2 cells after 24 h exposure as determined with the MTT assay. Results are expressed as percentage of viability compared with the control. The measured concentration that corresponds to each nominal concentration is shown in brackets. A value of zero indicates that the measured concentrations were similar to those measured in control media without ZnO. Data are represented as the mean ± SEM of at least three independent experiments. Different symbols are used to indicate statistical significant differences (simple, double and triple superscripts correspond to p < 0.05, p < 0.01 and p < 0.001, respectively), asterisks (*) are used to indicate differences with respect to the controls, α is used to indicate differences between both cell lines.
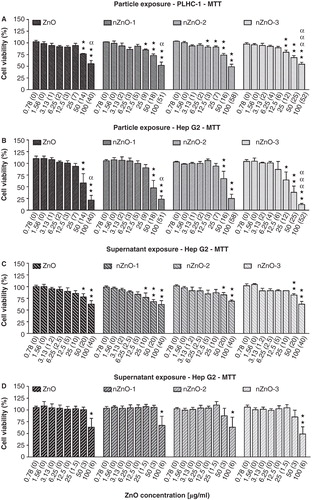
Table III. NOECs obtained for PS and Sup exposures of fish and mammalian cell lines by means of the different cytotoxicity assays taking into account measured concentrations.
Table IV. IC50 calculated from the cytotoxicity assay results after PS exposure of fish and mammalian cell lines.
Figure 7. Effects of ZnO particles suspensions and supernatants on PLHC-1 and Hep G2 cell viability after 24 h exposure as determined with the NR assay. Results are expressed as the percentage of viability compared with the control. The measured concentrations corresponding to the nominal concentrations are shown in brackets. A value of zero indicates that the measured concentration was similar to the one measured in control media without ZnO. Data are represented as mean ± SEM of at least three independent experiments. Different symbols are used to indicate statistical significant differences (simple, double and triple superscripts correspond to p < 0.05, p < 0.01 and p < 0.001, respectively), asterisks (*) are used to indicate differences with respect to the controls, α for differences between particle suspension exposures for each concentration in both cell lines.
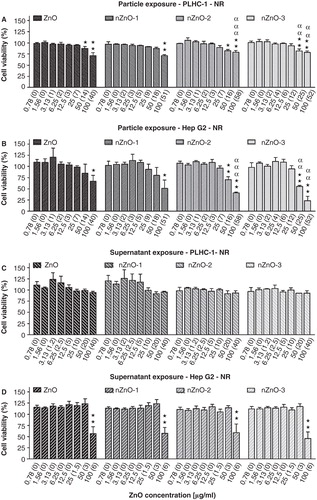
Figure 8. LDH leakage expressed as percent of control after exposure to serial dilutions of ZnO particle suspensions or supernatants in PLHC-1 and Hep G2 cells. The measured concentration that corresponds to each nominal concentration is represented in brackets. A value of zero indicates that the measured concentration was similar to the one measured in control media without ZnO. Columns represent the mean ± SEM of at least three independent experiments. Different symbols are used to indicate statistical significant differences (simple and double superscripts correspond to p < 0.05 and p < 0.01, respectively). Asterisks (*) were used to indicate differences with respect to the controls, α for differences between particle suspension exposures for each concentration in both cell lines.
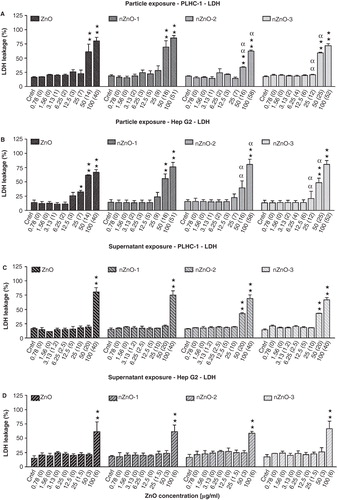
Figure 9. Effects of ZnO particles suspensions on PLHC-1 and Hep G2 cells after a 24 h exposure as determined with the new LUCS assay, measuring DNA alteration level. The data are presented as the mean ± SEM of at least three independent experiments. Significant differences with respect to the controls are indicated with asterisks (*p < 0.05 or **p < 0.01).
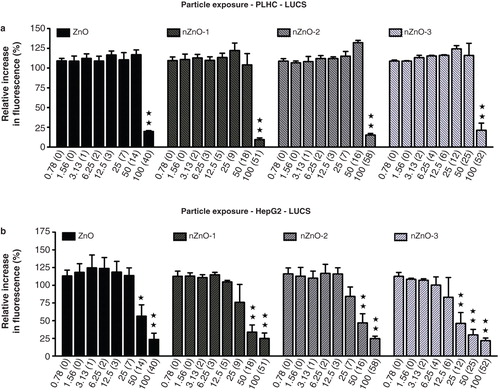
Table V. Sensitivity of the LUCS assay with respect to other cytotoxicity assays as calculated from the IC50 ratios.
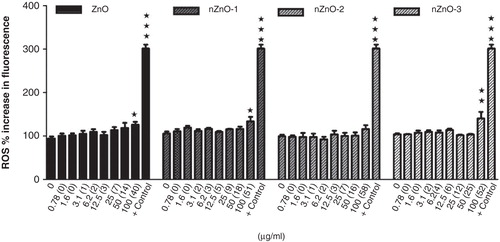
Figure 10. Effects of ZnO particles suspensions on ROS generation by PLHC-1 after a 24 h exposure period. The data are represented as the mean ± SEM of at least three independent experiments. Asterisks (*) represent significant differences (*p < 0.05;**p < 0.01) with respect to the controls. Chloramine-T (567.5 µg/ml) was used as positive control (+ control).