Figures & data
Figure 1. Intracellular ROS levels in the four cell lines following 24 h exposure to the different copper suspensions and Cu(NO3)2. ROS levels are quantified by measuring the % of increase in fluorescence with respect to the control (100%). Results are expressed as means ± standard error of the mean. Standard curves are presented using a four parameter logistic function to fit the data to a sigmoidal curve.
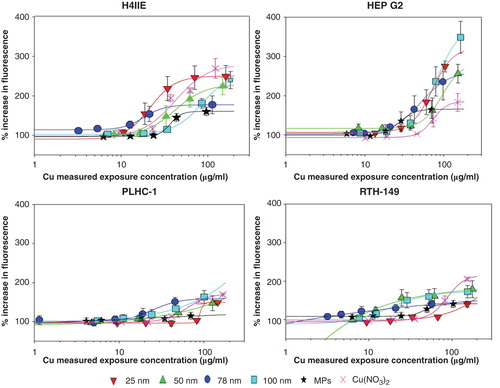
Figure 2. TEM images of copper particles (A) in their pristine form (prepared in ethanol) and (B) following 24 h incubation in EMEM culture medium under culture conditions (37°C/5% CO2). Scale bars indicate size (nm).
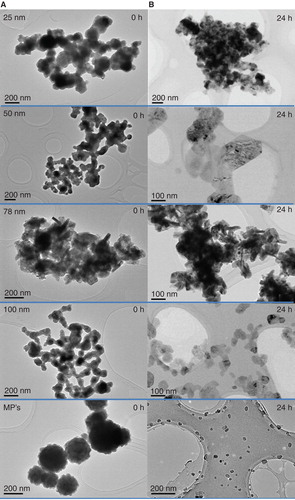
Figure 3. Size distributions of the copper particles measured by DLS directly after preparation (0 h) and after incubation (24 h) in four different culture media, designated H4IIE (37°C), HepG2 (37°C), PLHC-1 (30°C) and RTH-149 (20°C) according to the which cell line it is used for. Results are expressed as means ± standard deviation.
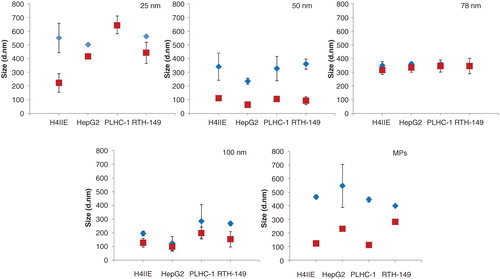
Table I. Nominal exposure concentration ranges vs. the measured concentration (ICP-MS) ranges expressed as mean ± standard deviation (µg Cu/ml of medium suspension).
Figure 4. Copper ion release profiles for the copper suspension (a) over time and (b) the ion release after 24 h incubation, expressed as percentage of the total copper suspension concentration. Results are expressed as means ± standard deviation.
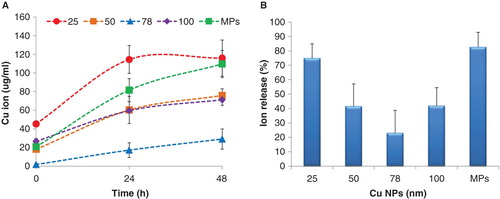
Figure 5. The IC50 caused by each copper suspension and the IC50 caused by the particle form in each copper suspensions to mammalian (H4IIE, HepG2) and piscine cell lines (PLHC-1 and RTH-149). The IC50 of Cu(NO3)2 for four types of cell lines is shown separately. Results are expressed as means ± standard deviation.
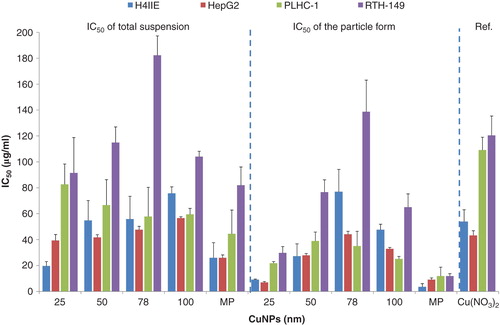
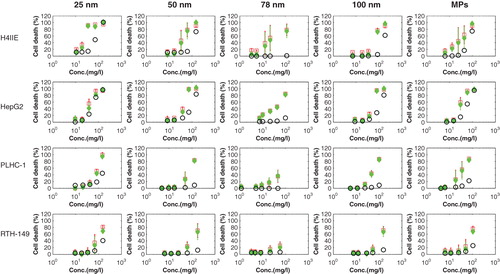
Figure 6. The total cellular toxicity (%) caused by copper suspensions (red, square), and the cellular toxicity (%) caused by particle forms of each copper suspension (CuNPs) (green, solid diamond) and Cu2+ (blue, circle) plotted against the total copper concentrations, respectively. Results are expressed as means ± standard deviation.