Figures & data
Figure 1. Body weight of rats after intratracheal instillation of SWCNTs: the vehicle control (0.1% Triton X-100 per rat; vehicle control) and the SWCNTs in the low-dose (0.2 mg SWCNTs per rat; L-SWCNT) or high-dose (0.4 mg SWCNTs per rat; H-SWCNT) groups. Values are mean ± SD. *p < 0.05, **p < 0.01 (vs. each vehicle control group).
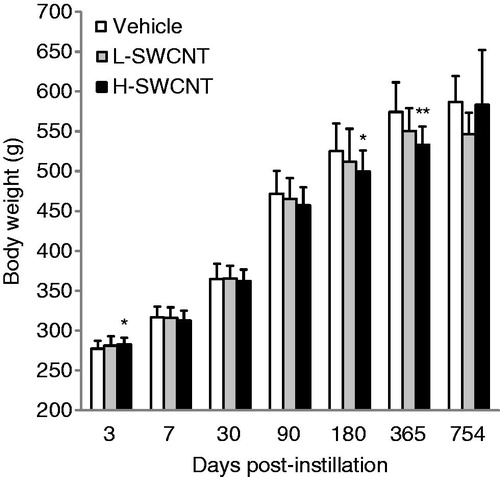
Figure 2. The dissected lungs from a rat exposed to SWCNTs at 3, 7, 30, 90, 180, 365 and 754 days post-instillation. The lungs were dissected at each post-instillation time in the three groups: the vehicle control (0.1% Triton X-100 per rat; vehicle control) and the SWCNTs in the low-dose (0.2 mg SWCNTs per rat; L-SWCNT) or high-dose (0.4 mg SWCNTs per rat; H-SWCNT) groups.
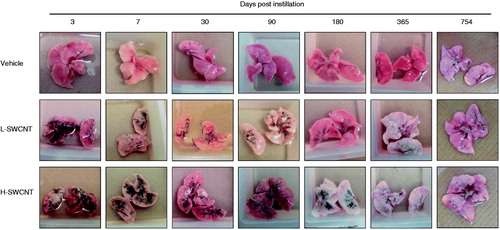
Figure 3. Micrographs of lung tissue from a rat exposed to SWCNTs at 3, 7, 30, 90, 180, 365 and 754 days post-instillation. After the rats were sacrificed, the lung tissues were fixed in 4% buffered paraformaldehyde, followed by embedding in paraffin, and the sections were stained with hematoxylin and eosin.
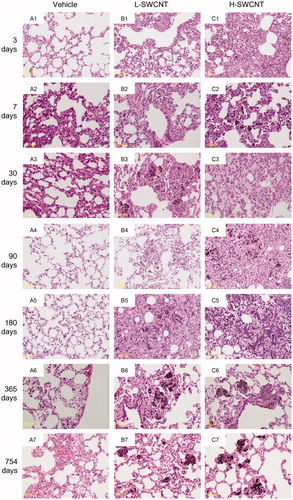
Figure 4. Genes with statistically significant upregulated/downregulated changes in expression at each time point in the L-SWCNT group and H-SWCNT group. Upregulated genes (A) or downregulated genes (B) with p values less than or equal to 0.05 at each time point, including overlaps between the L-SWCNT group and H-SWCNT group, were counted.
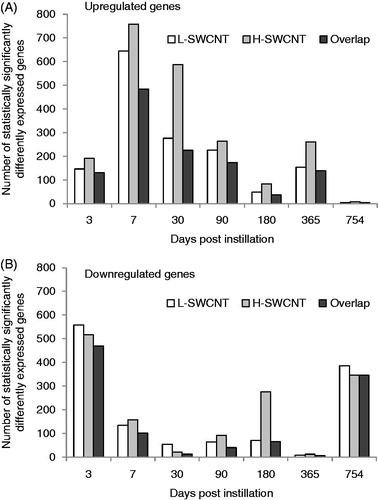
Figure 5. Time-dependent changes in p values of statistically over-represented GO terms of H-SWCNT-induced genes.
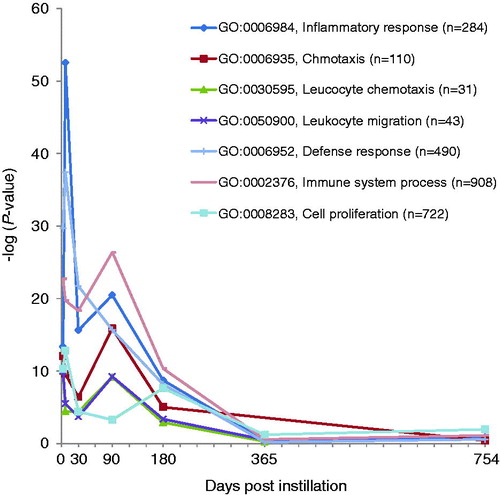
Table 1. Histopathological findings in the lung tissues intratracheally instilled with vehicle control, L-SWCNTs or H-SWCNTs.
Table 2. Time-dependent changes in statistically overrepresented GO terms of H-SWCNT-induced genes.
Table 3. Selected list of expressed genes involved in inflammatory response after intratracheal instillation with SWCNTs.
Table 4. Selected list of expressed genes involved in response to oxidative stress and apoptosis after intratracheal instillation with SWCNTs.
Table 5. Selected list of markedly up-regulated genes during the observation period in the L-SWCNT and H-SWCNT group.
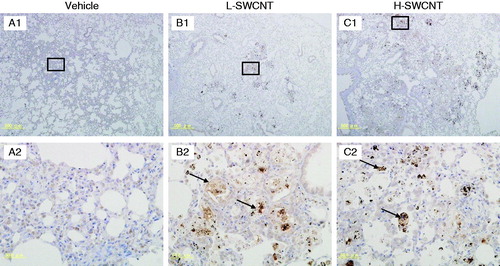
Figure 6. MMP12 immunostaining in lung tissues intratracheally instilled with vehicle control (A1 and A2), L-SWCNT (B1 and B2) or H-SWCNT (C1 and C2) at 90 days post-instillation.
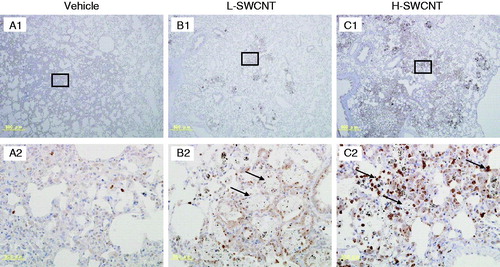
Figure 7. SPP1 immunostaining in lung tissues intratracheally instilled with vehicle control (A1 and A2), L-SWCNT (B1 and B2) or H-SWCNT (C1 and C2) at 90 days post-instillation.