Figures & data
Figure 1. Dynamic light scattering analysis of the size distributions of 100 nm A-PS and U-PS particles in TBS/RPMI. Size distributions of 100 nm A-PS (A and B) and 100 nm U-PS (C and D) nanoparticles in TBS-RPMI; 12.5 cm2/mL of particles in TBS with 5 mM Ca2+ were mixed with 50 µg/mL BSA (▪) or 50 µg/mL SP-A (▴) or TBS only (•) for one hour before being mixed with RPMI (TBS:RPMI; 2:3) and their size distributions immediately measured at 37 °C (A and C, T60) and again two hours later (B and D, T180). The final protein concentration was 10 µg/mL, and nanoparticle concentrations were 2.5 cm2/mL. Size distributions of nanoparticles in TBS only at T-2 are shown as dashed line.
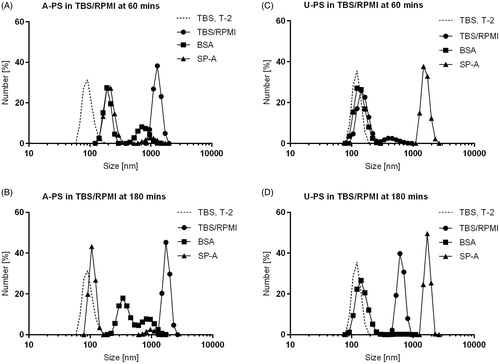
Figure 2. Effect of SP-A on A-PS and U-PS particle agglomeration. The effect of SP-A (10 µg/mL) in the presence and absence of calcium (2 mM) in PBS on the agglomeration of 100 nm fluorescent orange-labelled A-PS or 100 nm fluorescent green-labelled U-PS particles (3.8 cm2/mL) was evaluated using fluorescence microscopy. A-PS and U-PS particles were incubated with or without proteins for one hour at 37 °C before being mounted onto slides for microscopy. Pictures were taken at 400× magnification.
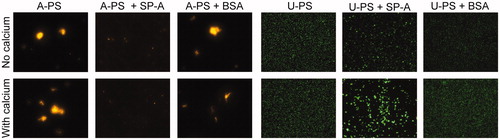
Table 1. Hydrodynamic size and zeta potential of A-PS and U-PS particles following incubation with SP-A or BSA.
Figure 3. The association of 200 nm unlabelled A-PS with (w) and without (w/o) SP-A to macrophage-like RAW264.7 cells visualised and quantified by CARS. (A) CARS images; 200 nm A-PS particles show up as white particles (arrows). Note that other –CH2-rich structures, such as the nuclear membrane, shows up as a visible ring in each cell (asterisks). (B) CARS images were analysed using MATLAB software as described in the materials and methods section. N = 4 per column. Shown is the mean ± standard derivation. p < 0.05 was considered statistically significant.
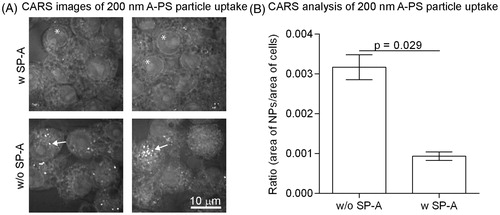
Figure 4. The effect of exogenous SP-A on the uptake of 100 nm A-PS and U-PS particles in macrophage-like RAW264.7 cells. Two-fold serial dilution of SP-A was incubated with fluorescent 100 nm A-PS or U-PS particles (3.8 cm2/mL) in the presence of calcium before incubating with RAW cells. Extra cellular association of NPs with cells were quenched using trypan blue. The particle uptake was analysed using FACS. Shown are the mean ± standard derivation of four independent experiments. *p < 0.05 and ****p < 0.0001.
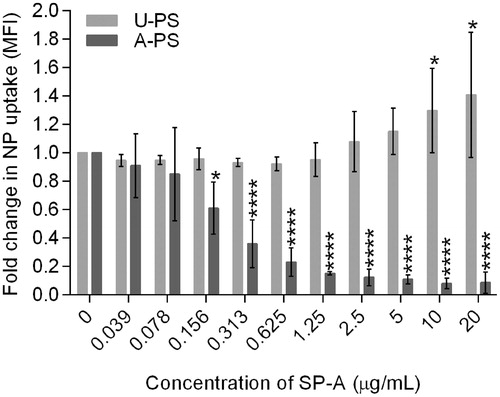
Figure 5. Uptake of U-PS and A-PS and the effects of 10 µg/mL SP-A on the uptake by alveolar macrophages isolated from wild-type and SP-A−/− mice. (A) Uptake of FITC labelled 100 and 500 nm U-PS and A-PS particles (5:1 NP/cell) by AMs isolated from wild type mice (light grey) and SP-A−/− mice (dark grey). (B) Fluorescent orange-labelled 100 nm A-PS (3.8 cm2/mL) in the absence (light grey) of presence (dark grey) of SP-A with AMs from wild-type mice and SP-A−/− mice. (C) Fluorescent green-labelled 100 nm U-PS (3.8 cm2/mL) in the absence (light grey) or presence (dark grey) of SP-A with AMs from wild-type mice and SP-A−/− mice. The statistical analysis was determined using unpaired t-test as described in the materials and method section. p < 0.05 was considered statistical significant and significant values are shown in the figure. Data show relative mean fluorescence intensity (MFI) ± standard derivation derived from three () and two () independent experiments with n = 3 mice per experiment.
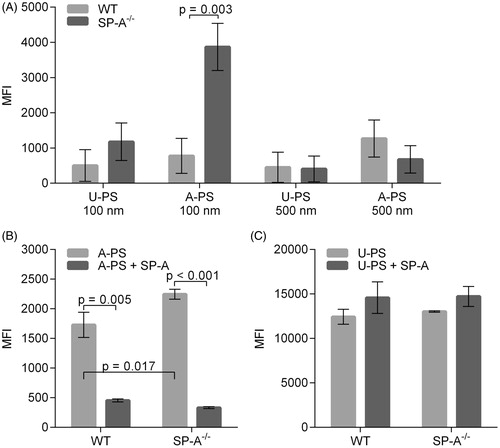
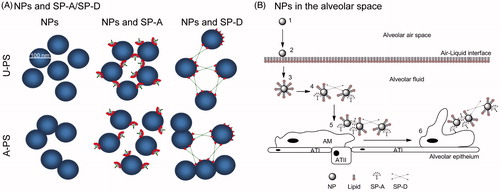
Figure 6. The role of collectins in agglomeration of NPs. (A) Differential interaction of SP-A, SP-D and rfhSP-D with 100 nm U-PS and A-PS particles. Both SP-A and SP-D agglomerates U-PS particles in the presence of calcium. A-PS particles tend to self-agglomerates at 37 °C but SP-A inhibits that by binding to the particles, whereas SP-D facilitates further agglomeration. The rfhSP-D binds to both A-PS and U-PS particles but does not facilitate agglomeration of the particles as seen with native SP-D (Kendall et al., Citation2013). The NPs, SP-A, SP-D and rfhSP-D are approximately to scale. (B) Simplistic model showing the roles of SP-A and SP-D and NP clearance in vivo in the alveolar space. Inhaled particles enter the alveolar space (1) and deposit onto the air-liquid interface of the alveolus (2). The particles are then displaced into the fluid phase through wetting forces, resulting in the formation of a lipid biocorona (3). The biocorona is then modified through the incorporation of surfactant proteins, potentially resulting in particle agglomeration dependent on the surface chemistry of the particle (4). Particle agglomerates are recognised by alveolar macrophages (5) and phagocytosed (6). ATI, alveolar epithelial type I cells; ATII, alveolar epithelial type II cells. Model not to scale.