Figures & data
Figure 1. Morphology and size distribution of deposited MWCNTs. (A) Transmission electron microscopy (TEM) images of 125 μg/ml MWCNTs deposited on TEM grids by using the ALICE system (scale bar: 5 μm). (B) Histogram represents the length distribution (in μm) of nebulised MWCNTs.
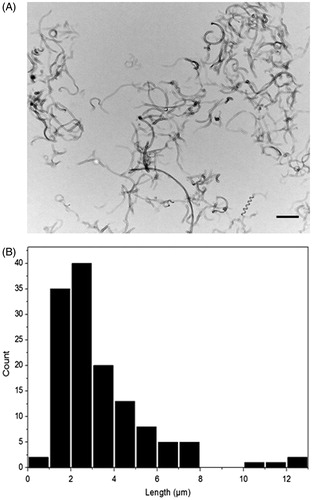
Figure 2. MWCNTs distribution and deposition after acute and repeated exposures. TEM images of deposited MWCNTs after (A) single exposure (B) one day and (C) three day repeated exposure (scale bar: 5 μm). (D) Graph represents the deposited values (µg/cm2) of MWCNTs after single and repeated exposures as measured by the QCM (n = 3).
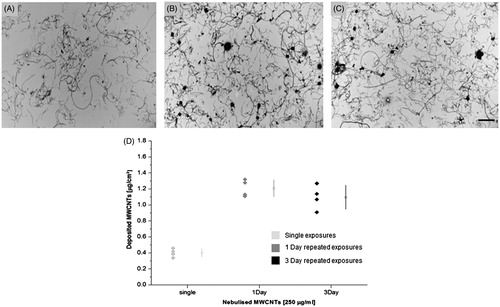
Figure 3. MWCNTs uptake in the triple cell co-culture after three day repeated exposure. TEM micrograph (A) of MDM exposed to MWCNTs repeatedly for three days. Higher magnification image of the MDM (A′) revealed the presence of MWCNTs (white arrows) inside of vesicles. Lower magnification image of A549 cell (B) exposed to MWCNTs for three days. Higher magnification micrograph of the epithelial cell (B′) showing MWCNTs present inside membrane bound compartments. MDDC exposed to MWCNTs (C) after three day repeated exposure at a low magnification. MWCNTs internalised by the MDDC and localizing within a vesicular structure (C′). White arrows indicate the position of MWCNTs. Images A–C scale bars: 5 µm. Images A′–C′ scale bars: 500 nm.
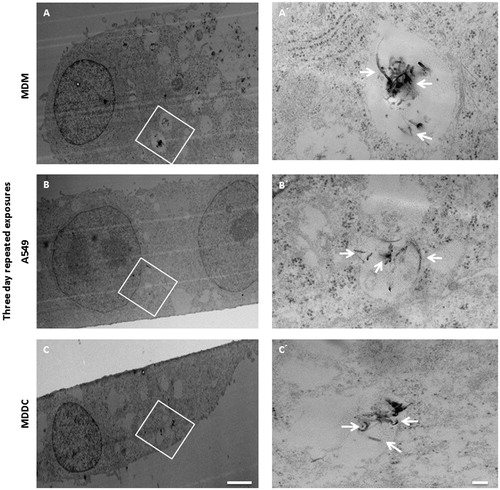
Figure 4. Cytotoxicity and cellular morphology, following repeated or single exposures. Cytotoxicity as estimated by quantification of LDH release in cell culture medium after (A) repeated and (A′) single exposures (shown relative to negative control). Confocal laser scanning microscopy images of triple cell-co-cultures exposed (B) repetitively and (C) single time to 0.39 µg/cm2 MWCNTs (scale bars: 20 μm). Red color shows F-actin (cytoskeleton), blue color shows DNA (cell nuclei). Data are presented as the mean ± standard error of the mean (SEM) (n = 3). Dashed lines (- - - ) represent the level of the negative control. *Indicates statistical significance compared to the negative control (p < 0.05), for the single and one day repeated exposure. #Represents a significant increase (p < 0.05) compared to the negative control for the three day exposure scenario.
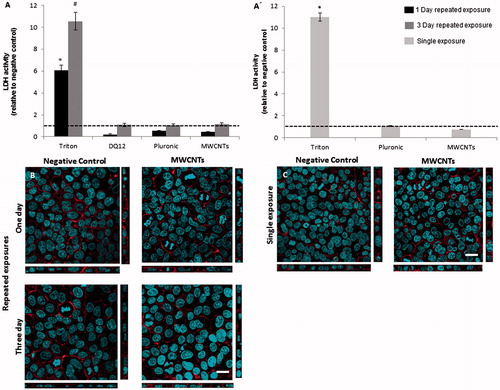
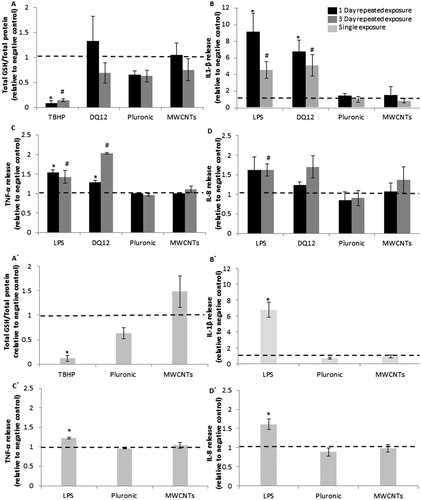
Figure 5. Biochemical response of triple co-cultures after repeated and single exposures to MWCNTs. Oxidative stress status (A) after repeated MWCNTs exposures either one (black) or three days (grey) and (A′) after single CNT exposure (light grey). Quantification of Interleukin 1-beta (IL-1β), after repeated (B) as well as single (B′) cell treatment. Tumor necrosis factor α (TNF-α) release, following (C) repeated or (C′) single MWCNTs aerosolisations. Interleukin 8 (IL-8) secretion 24 h after (D) repeated or (D′) acute exposures. Dashed lines (- - -) represent the level of the negative control. Data are presented as the mean ± standard error of the mean (SEM) of at least three independent experiments. Values were considered significantly different compared to the negative control with p < 0.05 (*single and one day, #three day exposure).