Figures & data
Figure 1. Analysis of PE wear with PolyWare Digital Edition demonstrating digital edge detection.
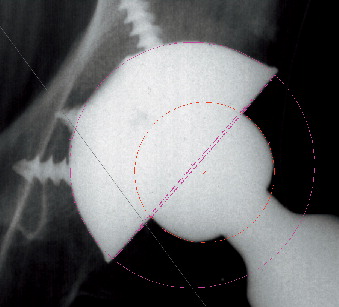
Table 1. Repeatability of radiographic double wear measurements within the strategies.
Figure 2. Patients 1 through 11 sorted by increasing magnitude of wear for each of the 3 (1-, 2-, and 6-radiograph) strategies.
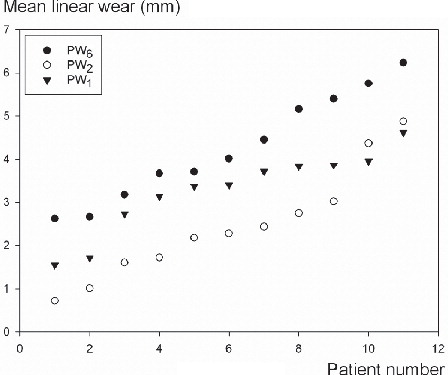
Table 2. Comparison of repeatability and concurrent validity between strategies
Figure 3. Bland-Altman plots (left) and scatter plots (right) with lines of equality for repeatability measures for each of the three strategies.PW6: PolyWare using 6 follow-up radiographs; PW1: PolyWare using only the final follow-up radiographs; PW2: PolyWare using the postoperative and the final follow-up radiographs. In the Bland-Altman plots (left-hand panels): x-axis, average of 2 measurements; y-axis, difference between 2 measurements (y = measurement 1 – measurement 2); red lines, 95% limits of agreement; dashed line, bias from 0; long solid green line, y = 0 line; dots, individual double measures. In the scatter plots (right-hand panels): x-axis, first measurement; y-axis, second measurement; maroon lines, lines of equality.
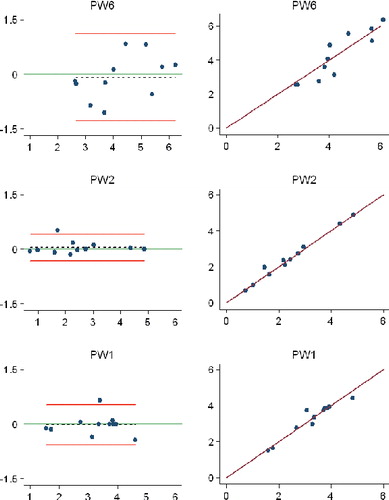
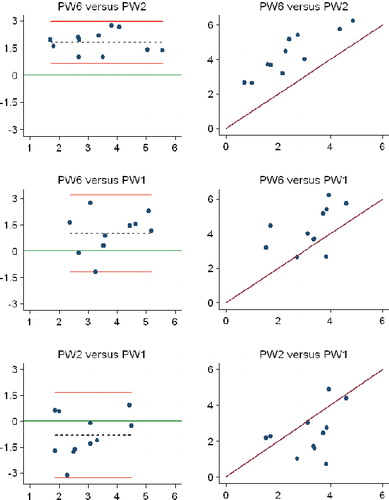
Figure 4. Bland-Altman plots (left) and scatter plots (right) with lines of equality for concurrent validity between the three strategies. PW6: PolyWare using 6 follow-up radiographs; PW1: PolyWare using only the final follow-up radiographs; PW2: PolyWare using the postoperative and the final follow-up radiographs. In the Bland-Altman plots (left-hand panels): x-axis, average of the measurements of 2 strategies; y-axis: difference between measurements of two strategies; red lines, 95% limits of agreement; dashed line, bias from 0; long solid green line, y = 0 line; dots, individual double measures. In the scatter plots (right-hand panels): maroon lines, lines of equality.