Figures & data
Figure 1. Description of the selection procedure.
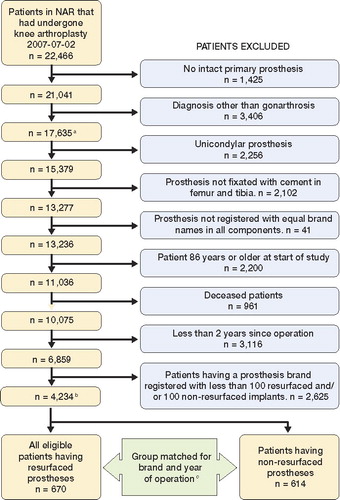
Table 2. Patient characteristics by prosthesis type and prosthesis brand
Figure 2. Mean outcome scores for resurfaced and non-resurfaced prostheses. The first 5 outcomes from the left represent the KOOS subscales. Adjustments were made for age, sex, preoperative EQ-5D index score (except for the outcome ΔEQ-5D), Charnley category, and prosthesis brand. Outcomes were measured on a scale from 0 to 100 units (worst to best).
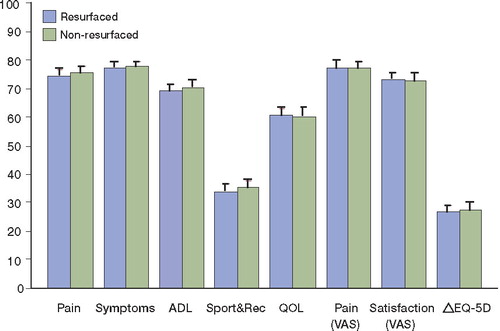
Figure 3. Mean outcome scores for resurfaced and non-resurfaced prostheses, for each brand of prosthesis. The first 5 outcomes from the left represent the KOOS subscales. Adjustments were made for age, sex, preoperative EQ-5D index score (except for the outcome ΔEQ-5D), and Charnley category. Outcomes were measured on a scale from 0 to 100 units (worst to best).
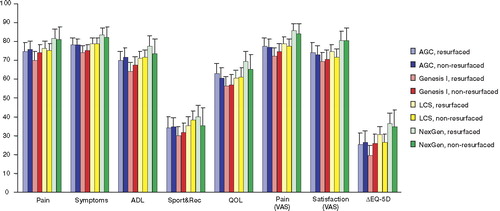
Table 3. Mean difference a in outcome between resurfaced and non-resurfaced prostheses
Table 4. Effects on mean outcome of gender, age, preoperative EQ-5D index score, time since operation, Charnley category and prosthesis brand
Table 5. Sensitivity analysis of potential bias due to different revision criteria from resurfaced and non-resurfaced implants