Figures & data
Figure 1. Method of measurement of the alpha angle (A) and anterior offset ratio (B).
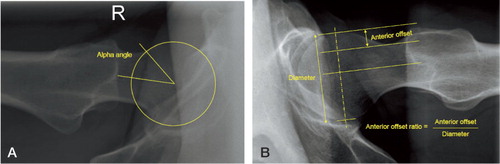
Table 1. Participants who were excluded
Table 2. Demographics, alpha angles, and anterior offset ratios for the participants who were included
Figure 2. Frequency distribution of the anterior offset ratios and alpha angles in the participants included.
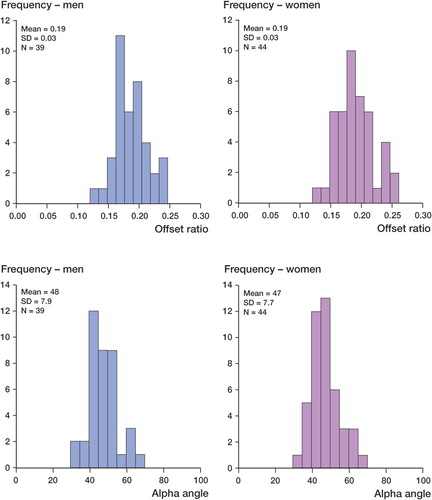
Table 3. Proposed 95% confidence and 95% reference intervals (mean ± 1.96 SD) of the alpha angle and anterior offset ratios, applicable to males and females
Table 4. Numbers of participants with at least one hip beyond the limits of the reference intervals (upper limit for alpha angle, lower limit for AOR) defined in Table 3. Percentages are given in parentheses
Figure 3. Graphs showing the relationship between rotation and alpha angle in the ten cadaver femora. The data are presented in 2 graphs to facilitate visual interpretation. There are four normal femora and one pistol-grip (cam) femur in each graph. The horizontal dotted lines represent 1 and 1.96 standard deviations above the mean.
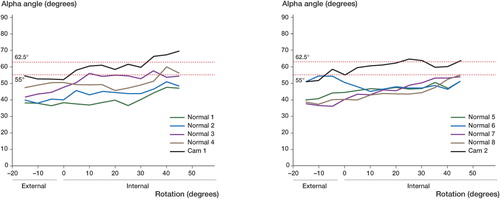
Figure 4. Graphs showing the relationship between rotation and anterior offset ratio in the ten cadaver femora. The data are presented in 2 graphs to facilitate visual interpretation. There are four normal femora and one pistol-grip (cam) femur in each graph. The horizontal dotted lines represent 1 and 1.96 standard deviations below the mean.
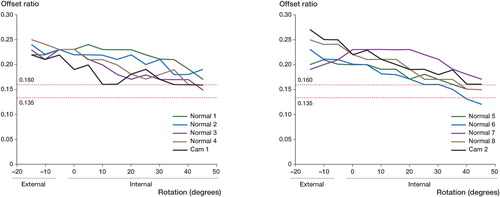
Table 5. Suggested mean and upper limit of the reference interval values for the alpha angle in the current literature, from studies of asymptomatic individuals, with a lateral (or equivalent) radiological projection