Figures & data
Table 1. Characteristics of knee arthroplasty patients and operative methods as registered in the NARA database, for the period 1997–2007
Table 2. Numbers of arthroplasties per hospital and year during the period 1997–2007
Table 3. Age- and sex-specific incidence rates of primary total knee arthroplasty per 100,000 inhabitants for the period 1997–2007. Note that due to reduced coverage, the Danish numbers have been underestimated by approximately 10–15%
Figure 1. Incidence of primary knee arthroplasties. The solid lines show the incidence and the dotted lines show the age-standardized incidence for the “European” standard population (Waterhouse et al. Citation1976). Note that due to reduced coverage, the Danish incidence was approximately10–15% higher than shown here.
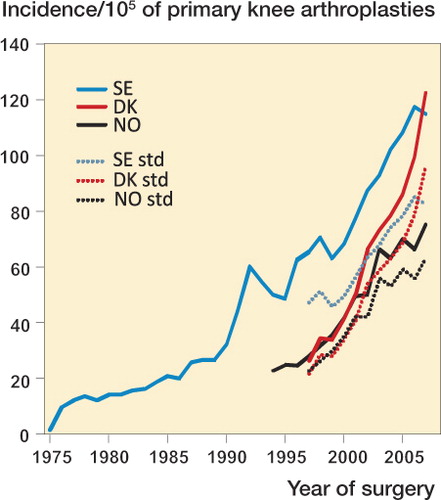
Figure 2. Proportion of age groups each year for primary knee arthroplasty.
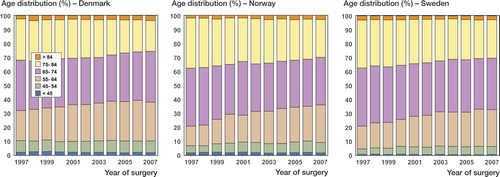
Figure 3. Incidence of arthroplasty for rheumatoid arthritis. Note that due to reduced coverage, the Danish incidence was probably 10–15% higher than shown here.
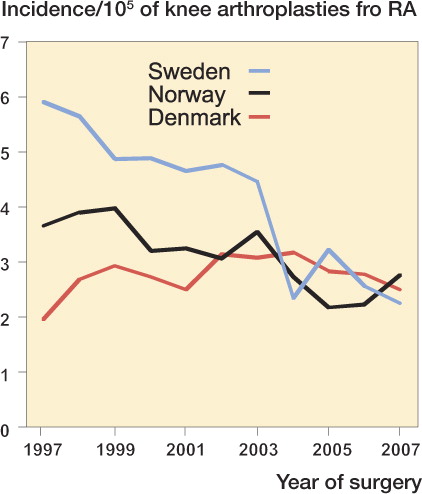
Figure 4. Proportion of implant types used for primary knee arthroplasty.
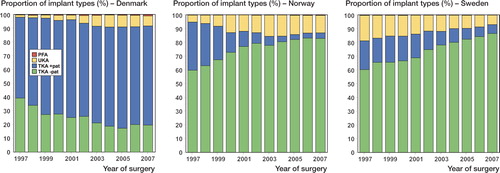
Figure 5. Proportion of fixation methods for primary TKA.
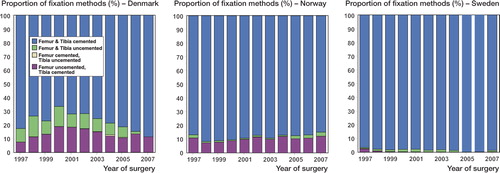
Table 4. The ten most commonly used TKA models in each country during the period 1997–2007
Table 5. The five most commonly used UKA models in each country during the period 1997–2007
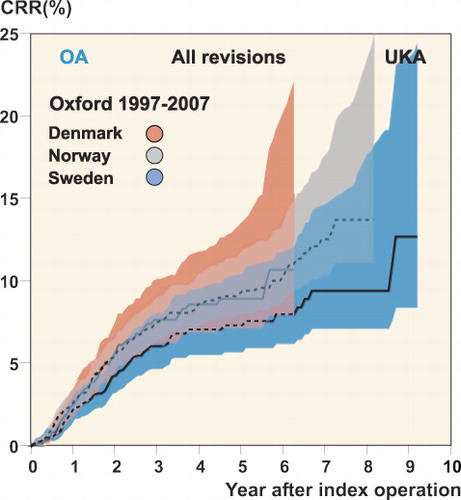
Figure 6. Cumulative revision rate (CRR; lines) with 95% CI (colored areas) after total knee arthroplasty performed for osteoarthritis.
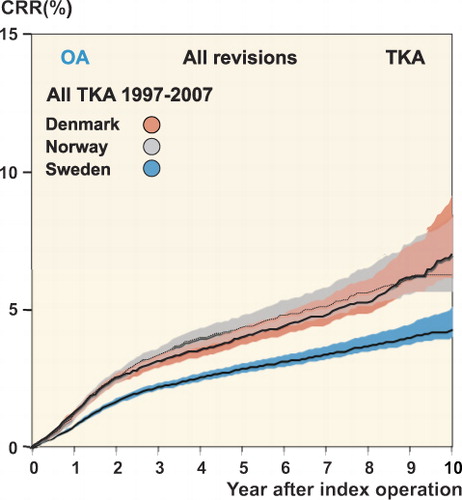
Figure 7. Cumulative revision rate (CRR; lines) with 95% CI (colored areas) for osteoarthritis cases only including the 3 implant brands that were used frequently in all 3 countries.
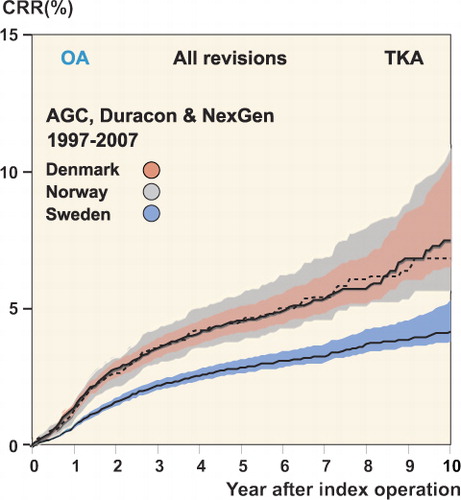
Figure 8. Cumulative revision rate (CRR; lines) with 95% CI (colored areas) after unicompartmental knee arthroplasty performed for osteoarthritis.
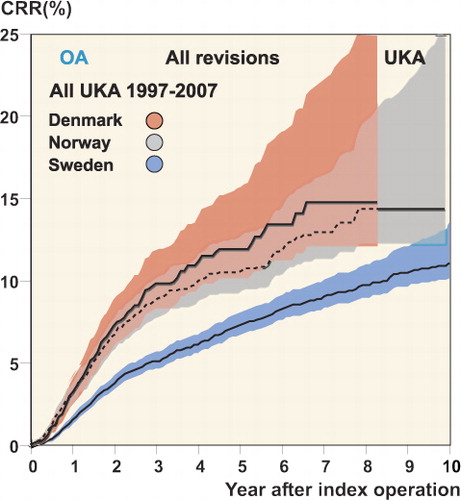
Figure 9. Cumulative revision rate (CRR; lines) with 95% CI (colored areas) for the Oxford unicompartmental implant inserted for osteoarthritis.