Figures & data
Figure 1. a) The plate with the central plug (left) and the pressure piston (right) b) tibia showing the bone surface under the titanium plate and the newly formed soft tissue under the pressure piston.
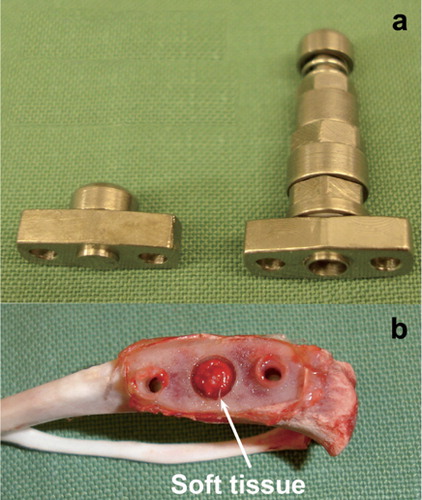
Figure 2. Transverse section of proximal tibia. The original plug protruded 0.1 mm deeper than the piston (the black line). The lowest position for the piston is 0.6 mm from the bone surface (the middle dotted line). The highest position is 1.4 mm from the bone surface, (the upper dotted line). Thus, a total volume of 8.6 mm3 under the piston, reduced to 4.5 mm3 when the piston is moved to the lower position during a pressure cycle.
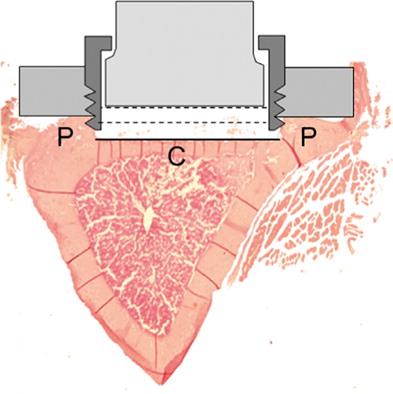
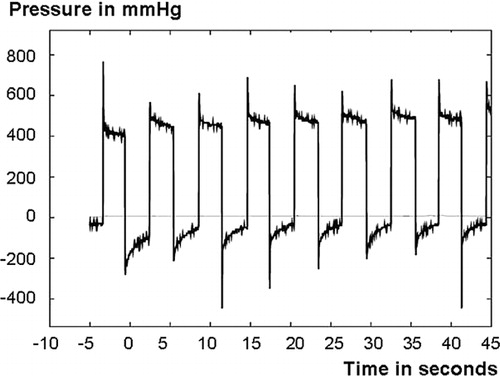
Figure 3. A typical pressure curve showing the maximum fluid pressure spikes and the following fluid pressure plateaus.
Study design of experiments describing characteristics of the mode
Figure 4. Maximum and plateau fluid pressure during the different follow-up days. Box plot with 10th, 25th, 50th, 75th and 90th percentiles.
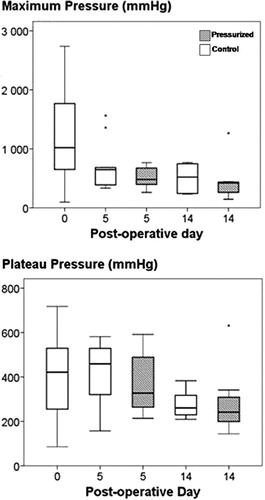
Figure 5. Bone density parameters from microCT and estimated fluid flow velocity. Note the decreased value in all parameters after 14 days of pressurizing. Box plot with 10th, 25th, 50th, 75th and 90th percentiles.
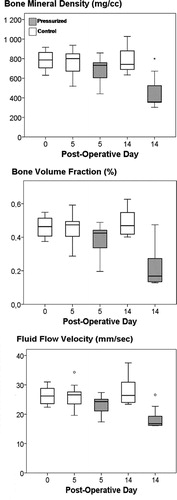
Figure 6. Transverse sections and 3D reconstructions of controls, 5 days pressure and 14 days pressure, showing the osteolytic development.
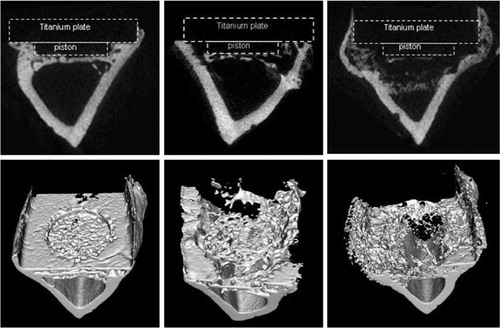
Figure 7. Superimposed microCT scans illustrating the average distribution of the osteolytic response (top). To produce the pictures, 9-10 scans from 9–10 different rats in each group were used and two symmetry axes imposed so that each point represent 36–40 experimental values. Here, darkest magenta represents solid bone, cyan, green and yellow represent increasing osteolysis and white represents absence of bone. Typical samples for illustration of specific bone scans below.
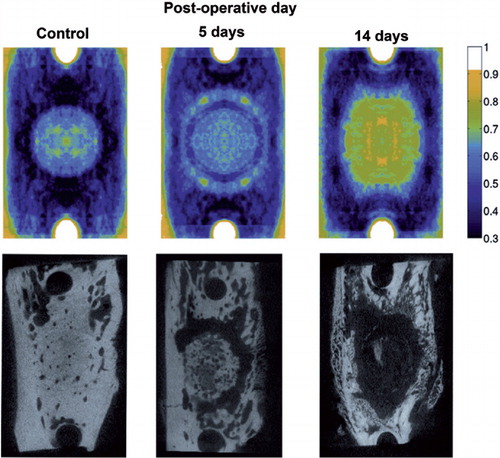
Figure 8. Titanium particles showing the fluid displacement during a pressure episode. Most of the titanium particles were found in cavities and canals within the bone at the peripheral zone around the pressurized area (right picture). The right picture shows titanium particles within pre-formed cavities in the peripheral zone of the bone. Arrows indicate titanium particles that were used as tracers the fluid displacement.
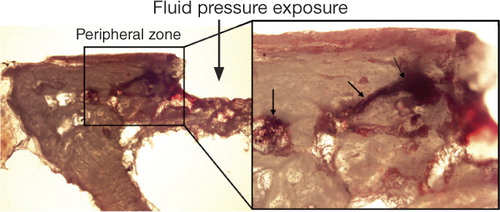
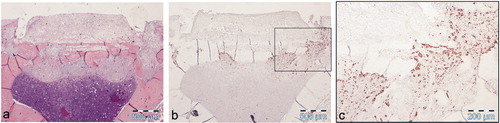
Figure 9. Specimen after 5 days of impact loading with different stainings. a) The soft tissue and the bone plate under the piston seen at 4× magnification (H&E), b) osteoclast activation concentrated under and beside the former piston seen at 4× magnification (immunohistochemistry for CatK), and c) activated osteoclasts within the bone plate seen at 10× magnification (CatK).