Figures & data
Table 1. Age, sex, and diagnosis at primary surgery in 4 time periods
Table 2. The most commonly used implants, in 4 time periods
Table 3. Fixation method for 4 time periods
Figure 1. Number of hips inserted using Simplex, Palacos, or cement types resembling Palacos (green), in 4 time periods. Blue represents other cement types.
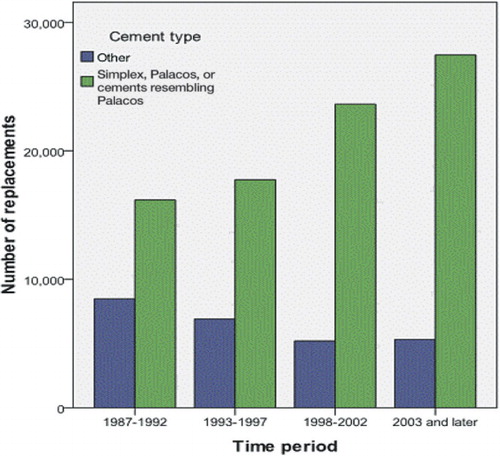
Table 4. Numbers of revisions due to specific causes for the 4 time periods
Figure 2. Numbers of revisions for different causes, in 4 time periods.
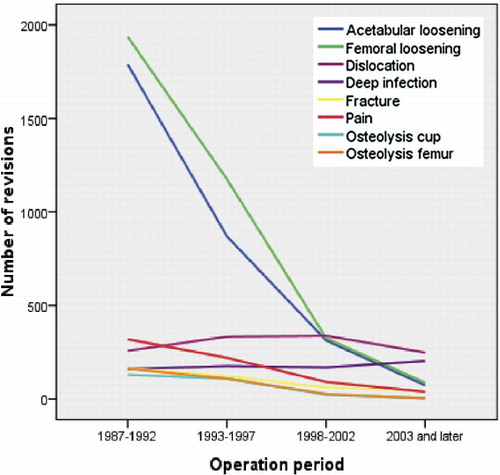
Figure 3. Kaplan-Meier survival plots. Revision for any cause in 4 time periods. A. All prostheses. B. All cemented prostheses. C. All uncemented prostheses. D. All hybrid prostheses.
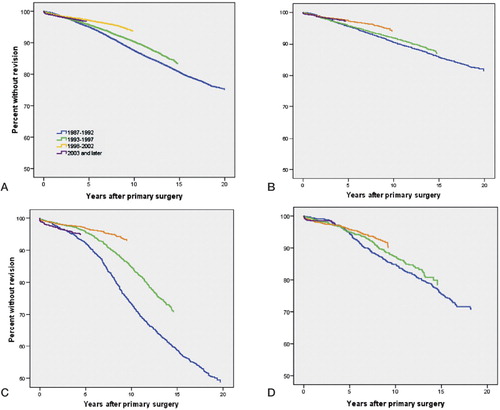
Table 5a. Relative risk of overall revision (due to any cause), aseptic loosening of acetabular component, aseptic loosening of femoral component, dislocation, and infection adjusted for age sex, and diagnosis (OA vs. other). All prostheses, n = 101,550
Table 5b. Relative risk of overall revision (due to any cause), aseptic loosening of acetabular component, aseptic loosening of femoral component, dislocation, and infection adjusted for age sex, and diagnosis (OA vs. other). All cemented prostheses, n = 86,929
Figure 4. Kaplan-Meier survival plot. Revision for any cause. A. 1987–2007. B. 1998–2007.
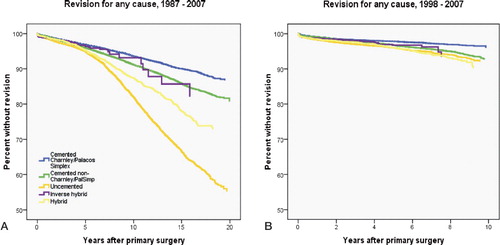
Table 5c. Relative risk of overall revision (due to any cause), aseptic loosening of acetabular component, aseptic loosening of femoral component, dislocation, and infection adjusted for age sex, and diagnosis (OA vs. other). Charnley prostheses with Palacos or Simplex cement, n = 28,225
Table 5d. Relative risk of overall revision (due to any cause), aseptic loosening of acetabular component, aseptic loosening of femoral component, dislocation, and infection adjusted for age sex, and diagnosis (OA vs. other). Other cemented prostheses, n = 58,704
Table 5e. Relative risk of overall revision (due to any cause), aseptic loosening of acetabular component, aseptic loosening of femoral component, dislocation, and infection adjusted for age sex, and diagnosis (OA vs. other). Uncemented prostheses, n = 14,621
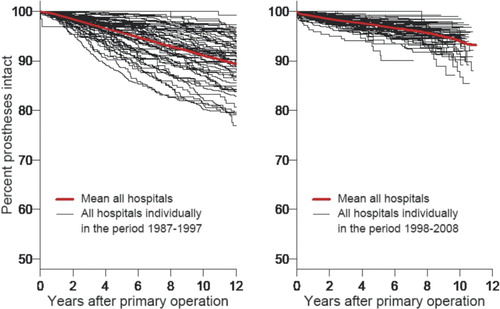
Figure 5. Kaplan-Meier survival plot for cemented hip prostheses: every hospital in Norway in 2 time periods. A. 1987–1997. B. 1998–2008.