Figures & data
Figure 1. Description of the selection procedure.
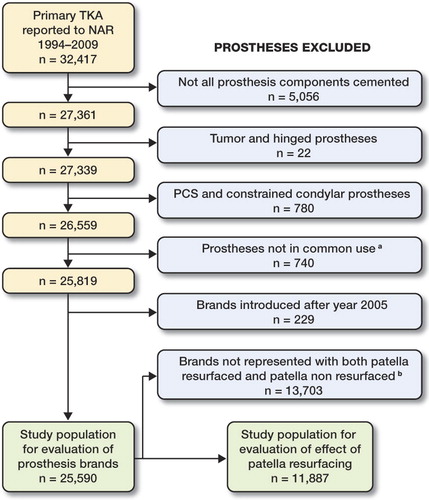
Table 1. Characteristics of primary total knee arthroplasties reported to the Norwegian Arthroplasty Register from 1994 to 2009
Figure 2. Time trends in the use of cemented patella resurfaced and patella non resurfaced TKAs in Norway, 1994–2008. 2009 was not included since follow-up was only until December 10, 2009.
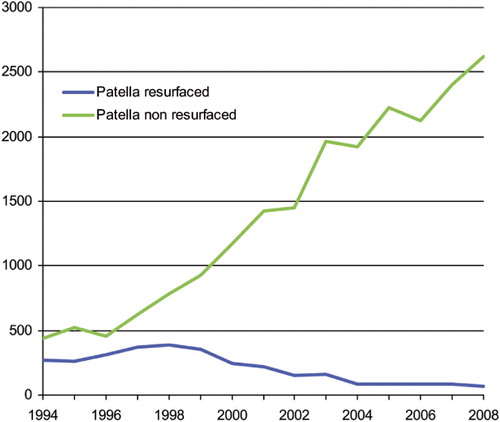
Table 2. Follow-up and numbers at risk by years after operation
Table 3a. Cox relative revision risk (RR) and survival percentages, estimated with all causes of revision as endpoint
Table 3b. Cox relative revision risk (RR) and survival percentages, estimated with all causes of revision as endpoint
Figure 3. Survival rates (%) for cemented patella resurfaced and patella non-resurfaced TKAs in Norway, 1994–2009; all revisions. Cox regression results with adjustment for age group, sex, diagnosis, previous operation of the knee, and brand of prosthesis.
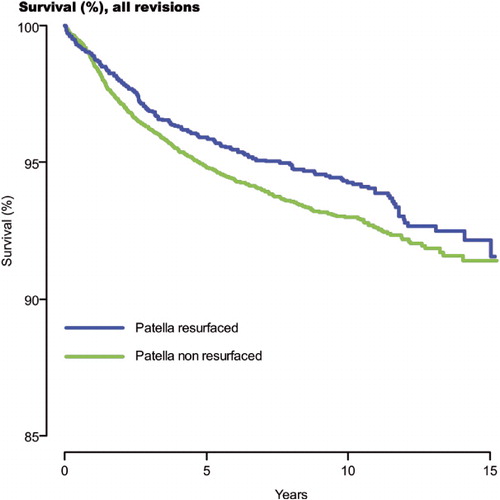
Table 4. Cox relative revision risk (RR), patella non resurfaced TKAs vs. patella resurfaced primary TKAs by reason for revision, 1994–2009
Figure 4. Survival rates (%) for cemented patella resurfaced and patella non resurfaced TKAs in Norway, 1994–2009; specific reasons for revision. Cox regression results with adjustment for age group, sex, diagnosis, previous operation of the knee, and prosthesis brand [(c), (g), (i) without adjustment for brand].
![Figure 4. Survival rates (%) for cemented patella resurfaced and patella non resurfaced TKAs in Norway, 1994–2009; specific reasons for revision. Cox regression results with adjustment for age group, sex, diagnosis, previous operation of the knee, and prosthesis brand [(c), (g), (i) without adjustment for brand].](/cms/asset/7a8605e9-7dc9-4f5a-b8c4-24a33025cff0/iort_a_570672_f0004_b.jpg)
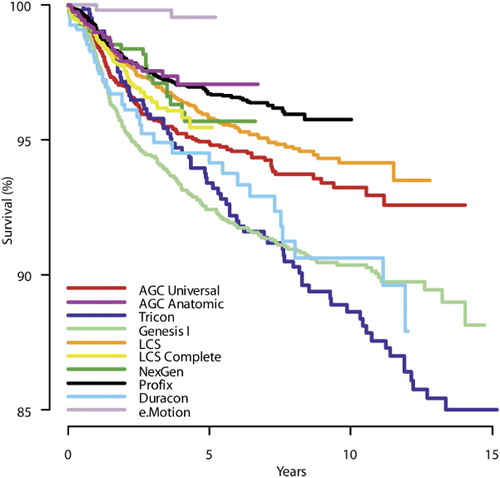
Figure 5. Survival rates (%) for cemented patella resurfaced prosthesis brands in Norway, 1994–2009; all revisions. Cox regression results with adjustment for age group, sex, diagnosis, and previous operation of the knee.
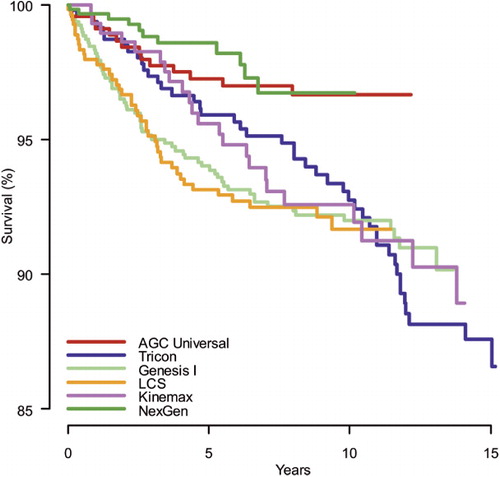
Figure 6. Survival rates (%) for cemented patella non resurfaced prosthesis brands in Norway, 1994–2009; all revisions. Cox regression results with adjustment for age group, sex, diagnosis, and previous operation of the knee.