Figures & data
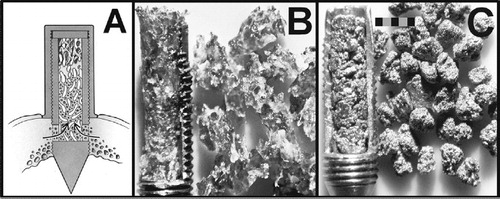
Figure 1. A. Cross-sectional drawing of an implanted bone chamber in the proximal tibia of the goat. B. Cylinder of impacted bone particles in an opened bone chamber (left) with the corresponding amount of graft before impaction (right). C. Cylinder of impacted titanium particles (left) with the corresponding amount of graft before impaction (right). Scale bar represents 2 mm.
Groups implanted, corresponding graft materials, and volume fractions (mean, SD) from cross-sectional views of the graft cylinder
Figure 2. Shape of the bone ingrowth front in empty chambers (A), allograft with graft remnants at the top (B), non impacted, coated titanium particles (C), and coated, impacted titanium particles (D) (Goldner staining).
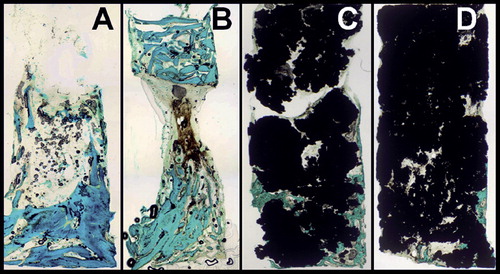
Figure 3. A. Osteoconduction of titanium particles with bone-surface contact (HE staining). B. Acid phosphatase staining (400×) with titanium microparticles (black arrows) engulfed by macrophages (solid white arrows).
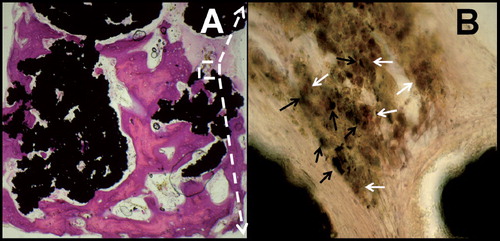
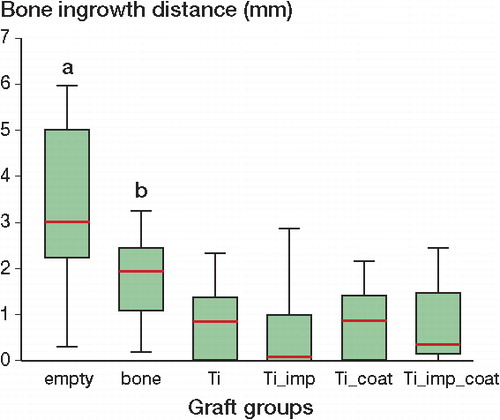
Figure 4. Box plot of graft groups and corresponding maximum bone ingrowth distances 12 weeks after implantation. Originally, empty bone chambers were more osteoconductive than bone chambers filled with osteoconductive bone or Ti particles (a, p ≤ 0.01). Bone particles were more osteoconductive than Ti particles (b, p ≤ 0.001).