Figures & data
Table 1. Illustration of data censoring and estimation of implant failure using the Kaplan-Meier (KM) and cumulative incidence methods
Figure 1. The probability of implant failure after primary total hip arthroplasty plotted against time using Kaplan-Meier estimate.
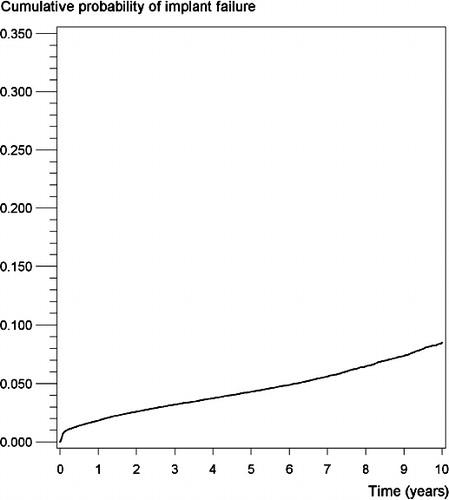
Figure 2. The probability of implant failure after primary total hip arthroplasty plotted against time using cumulative incidence estimate. Death is considered as the / a [authors: please choose one alternative] competing event.
![Figure 2. The probability of implant failure after primary total hip arthroplasty plotted against time using cumulative incidence estimate. Death is considered as the / a [authors: please choose one alternative] competing event.](/cms/asset/8b50fa77-7e7d-4877-a6d5-951e571eddd2/iort_a_588863_f0002_b.jpg)
Figure 3. Kaplan-Meier survival curves for implants A, B, and C with standard (solid line) and modified (dotted line) 95% confidence limits for implant A at 20 years. follow up.
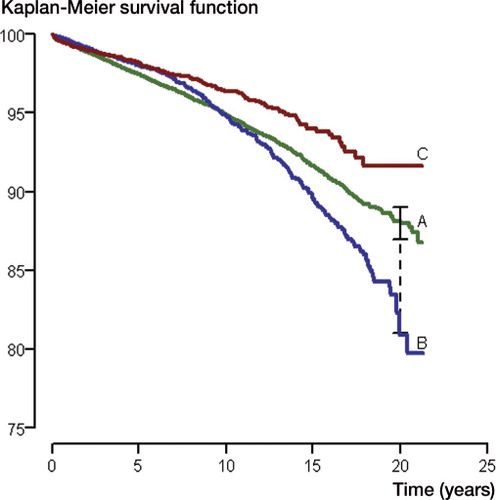
Figure 4. Log-minus-log Kaplan-Meier survival curves for implants A, B, and C.
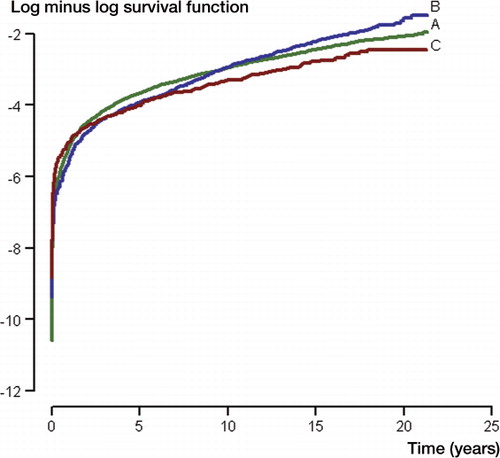
Figure 5. Smoothed scaled Schoenfeld residuals (solid line) with 95% confidence limits (dotted lines) are given for comparison of implant B with implant A (panel A) and for comparison of implant C with implant A (panel B). The graphs show that while early survival of implant B is better than that of implant A, survival of implant B is inferior with longer follow-up, and that survival of implant C is consistently better than that of implant A. The horizontal red line indicates no difference in hazard rates (ß(t) = 0 for all values of t or equivalent that the relative risk is equal to 1).
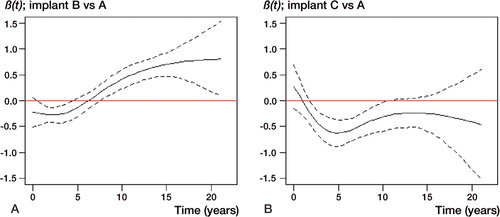
Table 2. Relative risk (RR) estimates based on Cox regression analyses for all observations (overall) and with restriction on survival times with cutpoints set at 5 and 10 years