Figures & data
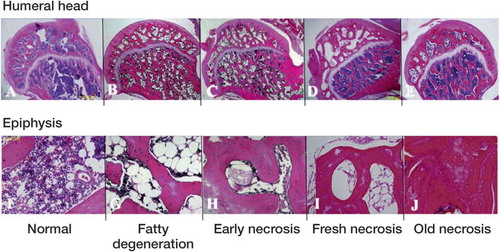
Figure 1. Illustration of histological criteria for ONF. The photomicrographs illustrate normal bone (A, F), fatty degeneration (B, G), early necrosis (C, H), fresh necrosis (D, I), and old necrosis (E, J) (stain: hematoxylin and eosin). The upper row shows whole femoral head (original magnification: ×20) and the lower row shows key findings of each category at high magnification. The fatty degeneration stage has fatty degeneration in the bone marrow (G), the early necrosis stage has myelocyte necrosis in bone marrow (H), the fresh necrosis stage has osteocyte necrosis (I), and the old necrosis stage has appositional bone formation (J).
Incidence of histological ONFH with pravastatin. Mean (SD)
Figure 2. Area of adipocytes in the bone marrow. The pictures in the upper row show that the adipocyte area in the bone marrow of the femoral head epiphysis was larger in group S (panel C) than in groups PS (panel D), C (panel A), or P (panel B) (stain: hematoxylin and eosin; original magnification: ×100). In the lower panel, the percentage area of adipocyte tissue in the bone marrow is compared for the 4 groups (see Results). Error bars indicate SD. a p < 0.001 (Fisher's exact test).
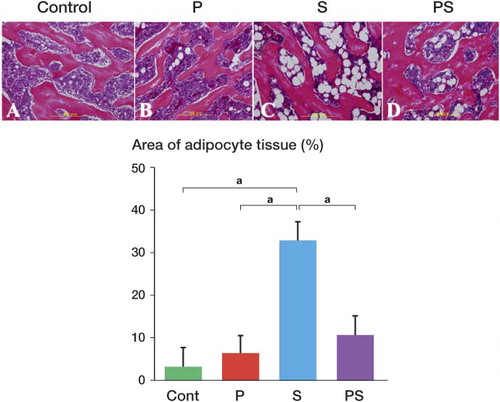
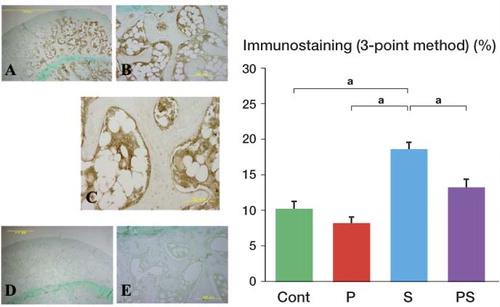
Figure 3. Comparison of oxidative stress (4-HNE). Very strong immunostaining was observed in group S (A, B), but the staining was very weak in group PS (D, E) in comparison. Magnification: ×20 (A, D), ×100 (B, E). C. Strong immunostaining in marrow cells, around adipocytes, and in vessel walls in group S. Magnification: ×200. F. The strongest staining was observed in group S, followed by group PS, group C, and group P with the 3-point method. Error bars indicate SD. a p < 0.001 (Fisher's exact test).