Figures & data
Figure 1. Flow chart of patients.
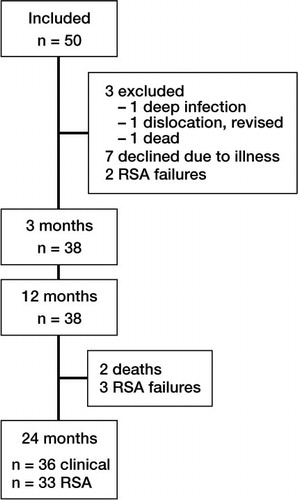
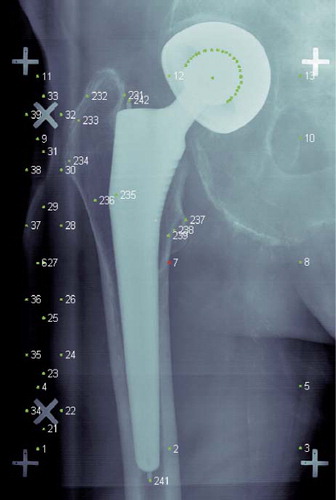
Figure 2. UmRSA radiograph of the Corail stem with a bi-articular Monk head. About 8 tantalum beads, 0.8 mm in diameter, were inserted in the bone (nos. 232–239). A tantalum bead of 0.8 mm in diameter was mounted on the tip of the stem (241) and at the shoulder of the stem (242). These 2 beads and the head were used to calculate stem configuration. In the case of hemiarthroplasty, the 26-mm head inside the Monk bi-articular head was visible and used. Cage markers: 1–40.
Pain scores. Values are mean (SD)
Figure 3. A. Pain reported on the VAS scale and distal migration at 3 months. Hip pain at rest is shown by black dots, and weight bearing by green. Thigh pain at rest is shown in red and weight bearing in yellow. B. Harris hip (HH) pain score and distal migration at 3 months. A Harris hip score of 40 means mild pain, and 44 means no pain.
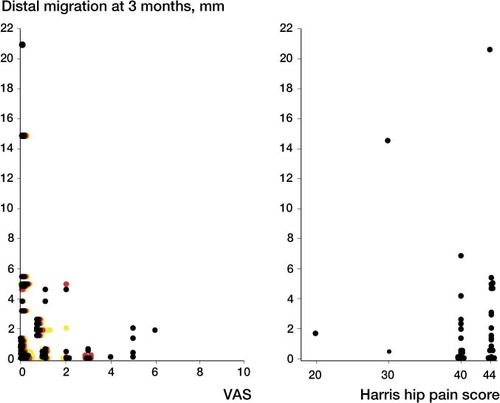
Figure 4. Mean movement. Error bars represent standard error (SE). A. Migration along axis. B. Rotation around axis. Blue: transverse axis; red: longitudinal axis; green: sagittal axis. First examination (0) before weight bearing and 1 week (0.25) before leaving the hospital. Between 3 and 12 months, mean rotation around the sagittal (z-) axis was 0.03–0.11 mm (p < 0.005) towards valgus. Mean migration and rotation in any other direction was not significant (p = 0.09–0.7). Between 12 and 24 months, mean rotation around the longitudinal (y-) axis was 3.4°–3.7° in the dorsal direction (p = 0.02) and mean migration along the transverse (x-) axis was 0.10–0.18 mm in the medial direction (p = 0.02), whereas migration and rotation in any other direction was not significant (p = 0.3–0.9) (t-test for dependent samples).
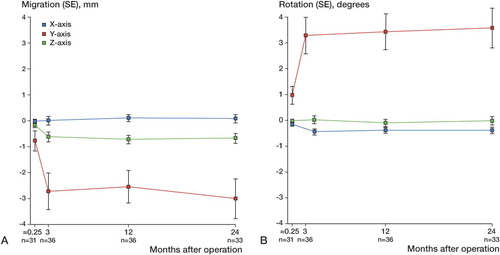
Figure 5. Distal migration: all case profiles.
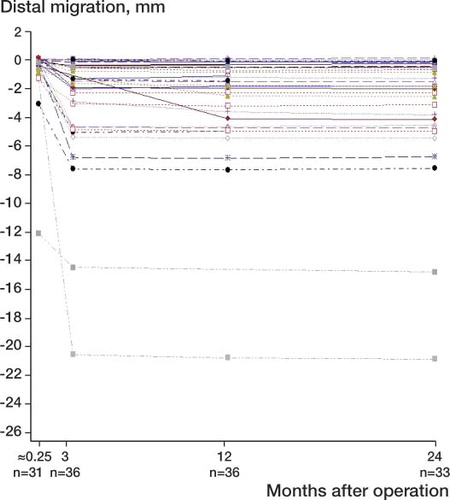
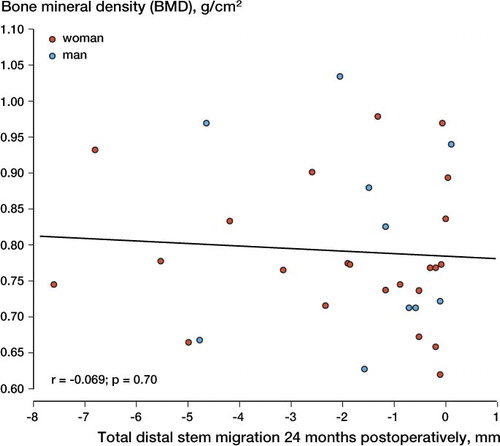
Figure 6. Relationship between bone mineral density of the uninjured proximal femur (measured with DEXA at the time of fracture) and distal stem migration 24 months postoperatively (measured with RSA) in 23 women and 10 men. The linear regression line is solid.