Figures & data
Figure 1. Levels of IL-7, VEGF, and MMP-1 in SF of patients classified into 3 OA-grading groups (grade 0, grade 1 or 2, and grade 3 or 4) or 3 age groups (< 40 years, 40–59 years, and > 60 years). The results from each individual are depicted. Bars indicate median concentrations. The dashed line indicates the detection limit. Significant differences between the groups are depicted by p-values; more significant p-values are written in bold.
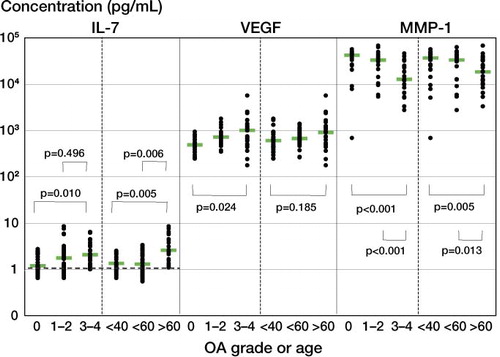
Figure 2. Correlation between age and IL-7 levels in SF. The results and OA grade of each individual are depicted. Grade 0: white circles. Grade 1: light-gray circles. Grade 2: dark-gray circles. Grade 3: black circles. Grade 4: black squares. The results for OA that affected all 3 knee compartments (pan-OA) are marked with a gray dash. The dashed line indicates the detection limit.
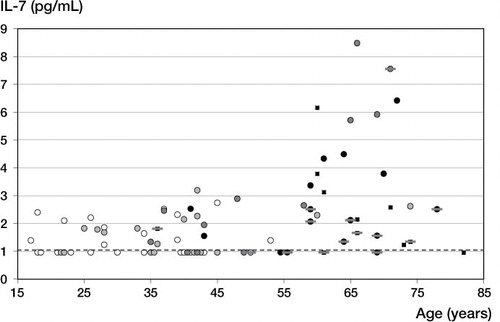
Figure 3. Correlation between BMI levels and IL-7 levels in SF. Spearman's rank correlation coefficient was 0.44 for all patients and 0.46 for patients without pan-OA. See the legend to Figure 2 for further details.
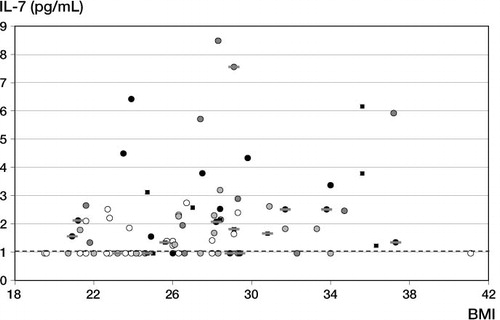
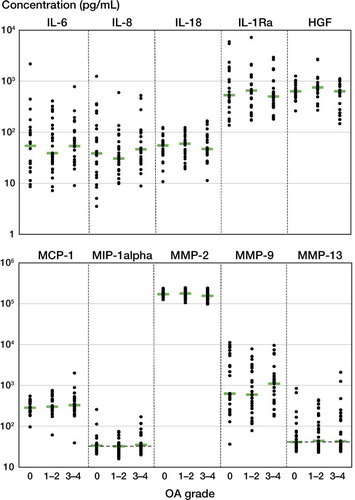
Figure 4. Cytokine and protease levels in SF of patients with OA grade 0, OA grade 1 or 2, or OA grade 3 or 4. The results from each individual are depicted. Bars indicate median concentrations. Dashed lines indicate detection limits. There was no significant difference in the levels of any particular mediator between groups.