Figures & data
Figure 1. Changes in coagulation markers in patients who underwent intermittent pneumatic compression only. Plasma levels of soluble fibrin (SF), plasminogen activator inhibitor type 1 (PAI-1), D-dimer, and thrombin-antithrombin complex (TAT) in patients who underwent intermittent pneumatic compression alone were measured preoperatively and on postoperative days 1 (PO1D), 3 (PO3D), 7 (PO7D), and 14 (PO14D). The boxes represent the interquartile ranges. The perpendicular lines (whiskers) represent the fifth and ninety-fifth percentiles and the horizontal bars in the boxes indicate the median values. On the day after surgery, the plasma levels of SF, PAI-1, and TAT were found to be increased in the venous thromboembolism (VTE) group compared to the non-VTE group. The changes in the D-dimer levels showed bimodal peaks on postoperative days 1 and 7 in both groups. Statistically significant differences were observed in the D-dimer levels measured on postoperative day 7. a p < 0.05 and b p < 0.01.
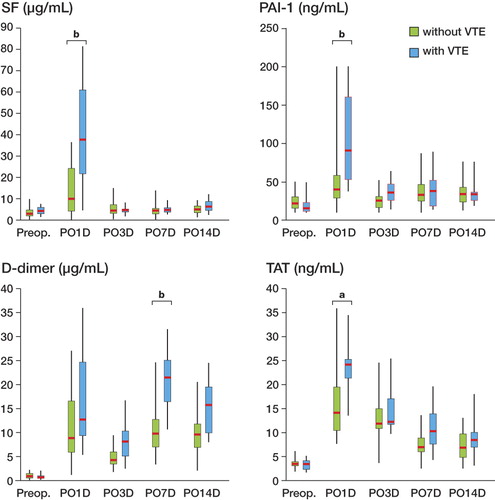
Figure 2. Changes in coagulation markers in patients who received subcutaneous injections of fondaparinux sodium. Plasma levels of soluble fibrin (SF), plasminogen activator inhibitor type 1 (PAI-1), D-dimer, and thrombin-antithrombin complex (TAT) in patients who received subcutaneous injections of fondaparinux sodium were measured preoperatively and on postoperative days 1 (PO1D), 3 (PO3D), 7 (PO7D), and 14 (PO14D). The boxes represent the interquartile ranges. The perpendicular lines represent the fifth and ninety-fifth percentiles and the horizontal bars in the boxes indicate the median values. The levels of SF, PAI-1, D-dimer, and TAT were similar in the patients in the fondaparinux group who had or did not have VTE.
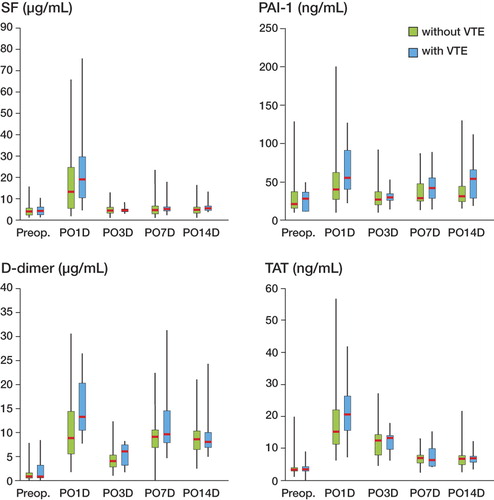
Figure 3. Receiver operating characteristic (ROC) curve analysis of the accuracy of the quantitative soluble fibrin (SF), plasminogen activator inhibitor type 1 (PAI-1), and thrombin-antithrombin complex (TAT) levels on postoperative day 1 and D-dimer levels on day 7. The area under the ROC curve (AUC) is given in each diagram with the 95% confidence interval in parentheses.
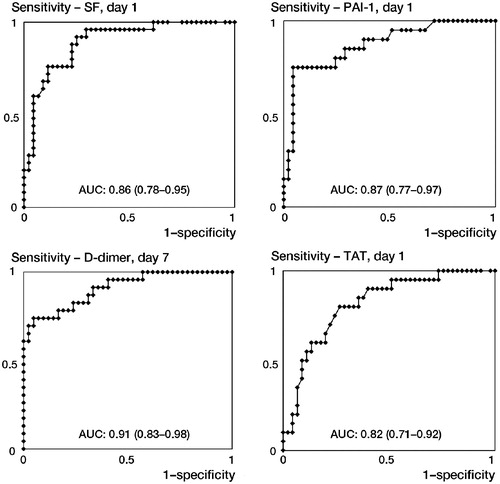
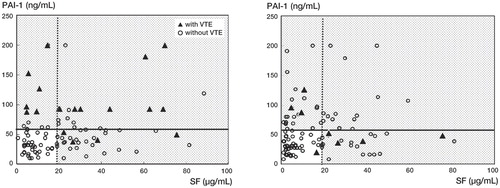
Figure 4. Discrimination of postoperative venous thromboembolism (VTE) using levels of soluble fibrin (SF) and plasminogen activator inhibitor type 1 (PAI-1). Increases in either SF or PAI-1 on postoperative day 1 above their cut-off levels provided 100% sensitivity and 67% specificity in predicting VTE when patients were not given fondaparinux sodium postoperatively (left panel). In addition, when this criterion was applied to patients who received subcutaneous injections of fondaparinux following surgery, 7 of the 8 patients with VTE met the criterion and a 98% (48/49) negative agreement rate was found (right panel).