Figures & data
Table 1. Baseline characteristics. Values are mean (SD)
Figure 1. CONSORT flow chart.
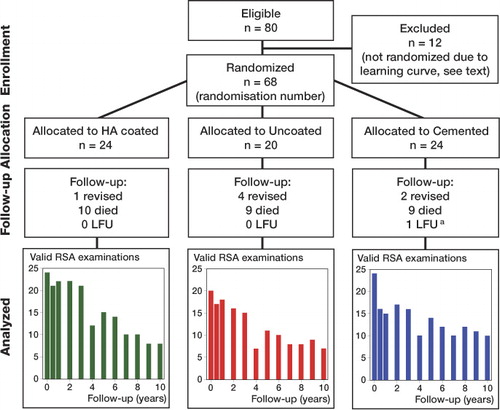
Figure 2. Migration in maximum total point motion (MTPM) (mean and standard deviation) according to the duration of follow-up in the hydroxyapatite (HA) group (green boxes), the uncoated group (red boxes), and the cemented group (blue boxes). The direct postoperative RSA radiograph is the reference. The groups differed significantly in migration (p < 0.001, GLMM). Missing values at 4-year follow-up were estimated as the mean of the 3-year and 5-year follow-up.
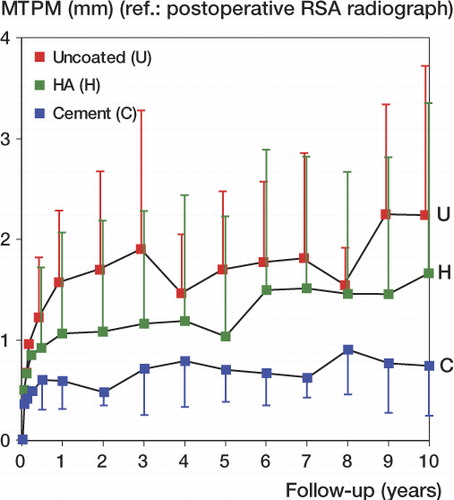
Figure 3. Migration from 1 to 10 years in maximum total point motion (MTPM) (mean and standard deviation) according to the duration of follow-up in the hydroxyapatite (HA) group (green boxes), the uncoated group (red boxes), and the cemented group (blue boxes). The 1-year postoperative RSA radiograph is the reference. The groups differed significantly in migration (p < 0.001, GLMM). Missing values at 4-year follow-up were estimated as the mean of the 3-year and 5-year follow-up.
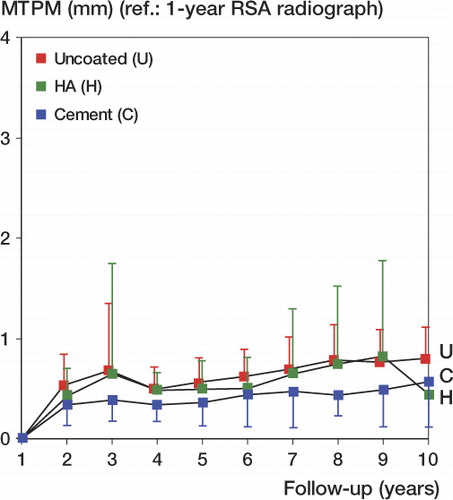
Figure 4. Migration from 1 to 16 years in maximum total point motion (MTPM) of individual cases with 10 years of RSA follow-up or more according to the duration of follow-up in the hydroxyapatite (HA) group (upper row), the uncoated group (middle row), and cemented group (lower row). The 1-year postoperative RSA radiograph was the reference.
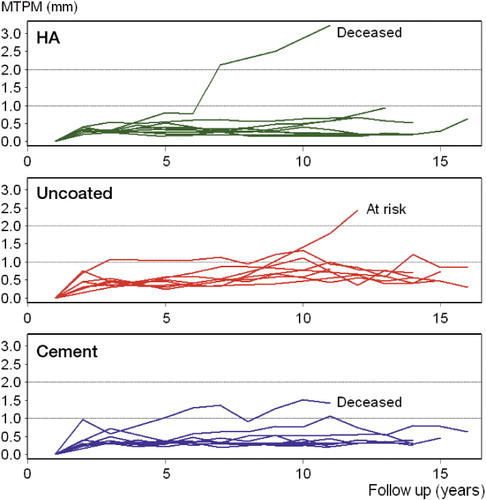
Table 2. Clinical and radiographic results
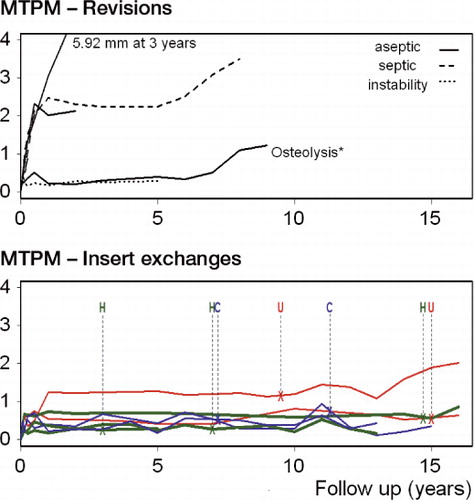
Figure 5. Individual migration patterns of the liner exchange and revised cases (with the postoperative radiograph as reference). For the insert exchanges, the letters at the top indicate the time of insert exchange with blue C for cemented tibial components, green H for HA-coated tibial components, and red U for uncoated tibial components. The tibial components remained securely fixed after the exchange of insert.