Figures & data
Table 1. Precision of RSA measurements (upper limits of 95% confidence interval)
Table 2. Details of patients with a failed Exeter stem
Figure 1. Patient 3 with a complete circumferential cement mantle fracture. a) 6 weeks post-operative radiograph: No abnormalities were seen. b) 2 year follow-up radiograph: A cement mantle fracture in Gruen zone IV is noted. c) 5 year follow-up radiograph: A complete circumferential cement mantle fracture is present. d) 10 year follow-up radiograph: Increased separation of the cement mantle. Between the 2 and 3 year RSA examination, a sudden and substantial increase in subsidence and retroversion of the stem was measured. At 12 year follow-up, subsidence was 9.7 mm and retroversion 11°.
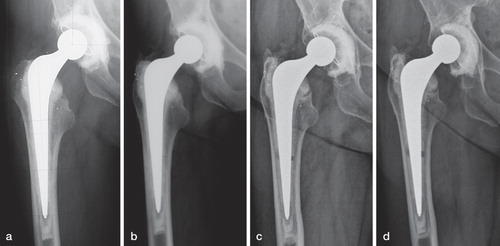
Figure 2. Subsidence (upper) and rotation in retroversion (lower) of the Exeter stems without cement mantle fractures (mean and 95% confidence interval, blue line) and of the individual failed components (red lines). The estimated yearly increase (slope of regression line) between 2 and 12 years was respectively 0.08 mm/year (95%CI: 0.05 – 0.12) and 0.07°/year (95%CI: 0.02 – 0.12). Failures 1, 3 and 4 had a complete circumferential cement mantle fracture. Solid grey lines represent migration of individual non-failed components.
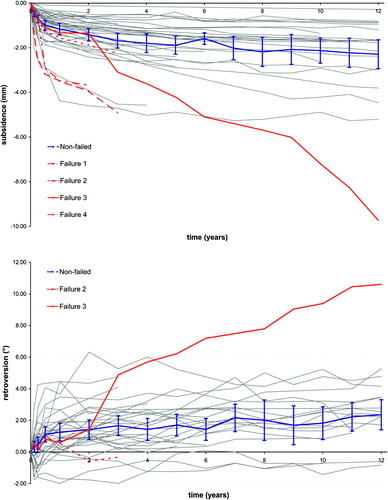
Table 3. Migration of the Exeter femoral stem and estimated annual rate over 2–12 years of follow-up of 37 femoral stems without cement mantle fractures
Table 4. Mean difference in migration a over 2–12 years of follow-up between stems cemented with high- or low-viscosity cement (37 femoral stems without cement mantle fractures)