Figures & data
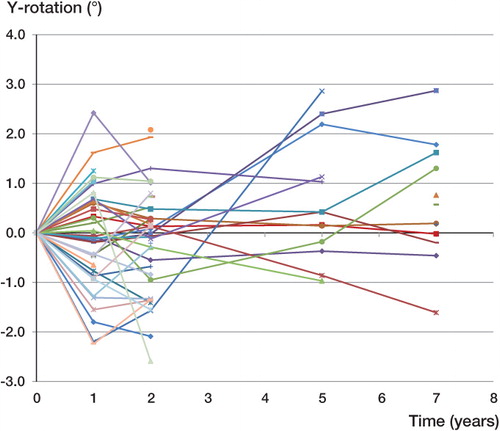
Figure 1. Implant after stage-2 (S1) surgery with tantalum RSA beads.
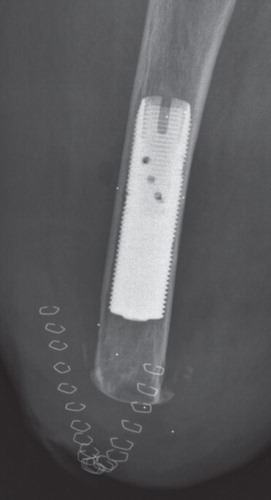
Figure 2. Implant with the addition of the transcutaneous abutment after stage-2 (S2) surgery.
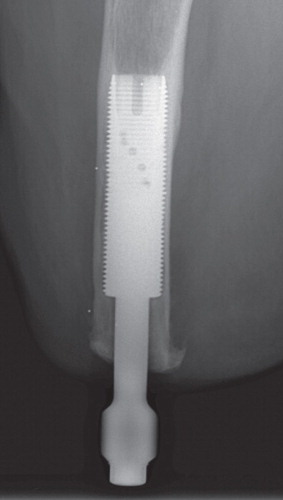
Figure 3. The UmRSA 6.0 software interface with cage beads, implant beads, and femur beads marked in green and red. An implant bead is selected and zoomed in on in the middle of the screen.
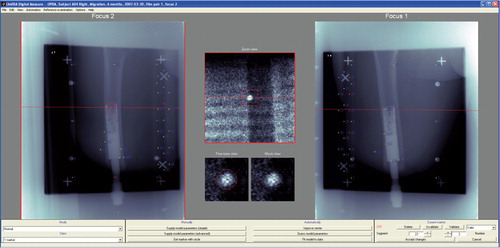
Figure 4. The defined directions of rotation of the implant.
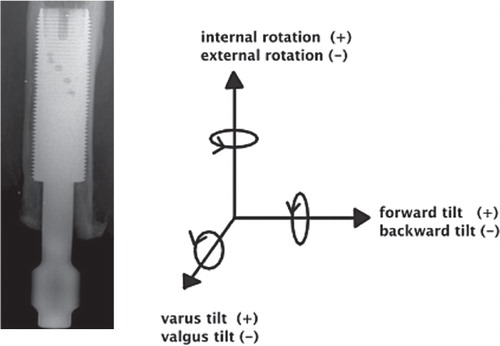
Figure 5. The bone surrounding the implant is divided into zones 1–6, A, and B for medial and lateral assessment of bone remodeling and zones 7–12, C, and D for anterior and posterior assessment of bone remodeling.
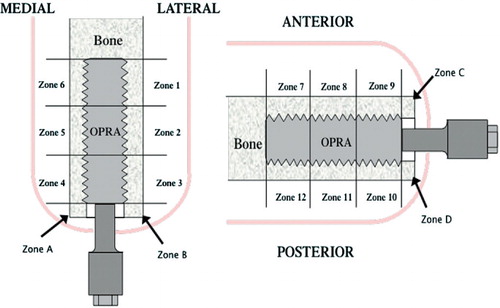
Figure 6. Distal bone resorption: zones A–D. Endosteal resorption: zones 1–12. Cortical thinning: zones 1–12. Cancellization: zones A–D and 1–12. Trabecular streaming or buttressing: zones 1, 6, 7, and 12. The stage-1 postoperative film shows the bone immediately following implantation of the device. Each 2-year film shows an example of distal bone resorption (panel a), endosteal resorption (b), cortical thinning (c), cancellization (d), and trabecular streaming or buttressing (e).
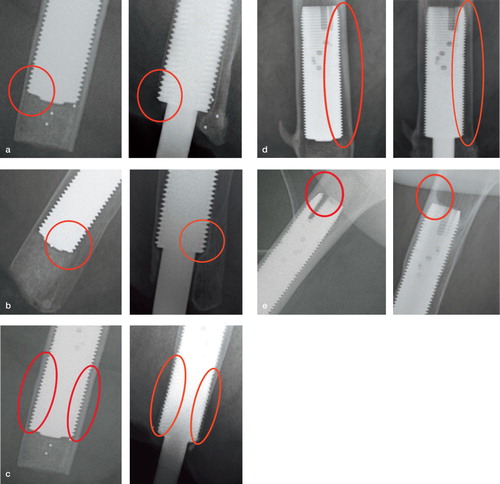
Table 1. Reason for exclusion from RSA analysis and patient count at each interval
Table 2. Proximal/distal migration (in mm) of the implant at 1, 2, 5, and 7 years of follow-up
Table 3. Rotation about the x–, y–, and z–axes (in degrees) of the implant at 1, 2, 5, and 7 years of follow–up
Figure 7. Individual proximal/distal migration (in mm) of the OPRA implants over time.
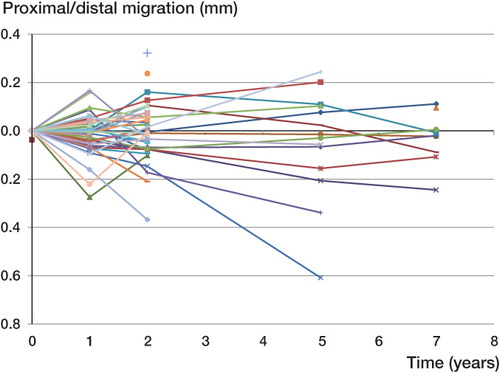
Figure 8. Individual rotation (in degrees) about the y-axis—the long axis of the femur—of the OPRA implants over time.