Figures & data
Table 1. Implant characteristics (femoral head size and material, acetabular liner thickness and rim design) for the HGPI and HGPII cohorts
Table 2. Implantation time, patient age at revision, and patient BMI for the HGPI and HGPII cohorts
Table 3. Indications for revision for the HGPI and HGPII cohorts
Table 4. Preoperative diagnoses for the HGPI and HGPII cohorts
Figure 1. Retrieved acetabular components showing: type I subsurface cracking (HGPII) (panel A), type II fracture (HGPII) (panel B), and type III fracture (HGPII) (panel C).
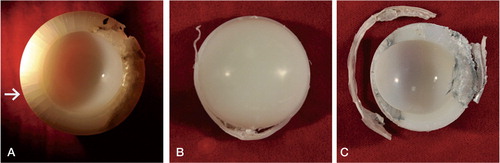
Table 5. Mean (SD) damage scores by mode of damage to articular and backside surfaces
Figure 2. White bands seen on a micrograph of a thin section of: an HGPI that had been in situ for 22 years (panel A), and an HGPII that had been in situ for 15 years (panel B).
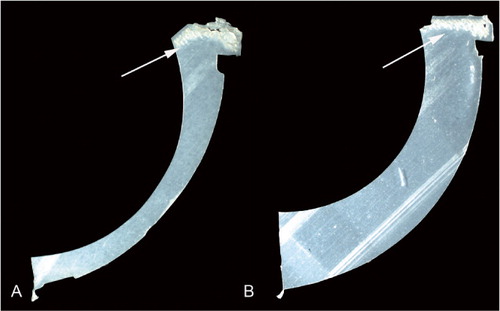
Figure 3. Box plots of maximum ASTM oxidation index for the superior articulating surface and the rim, for the HGPI and HGPII cohorts.
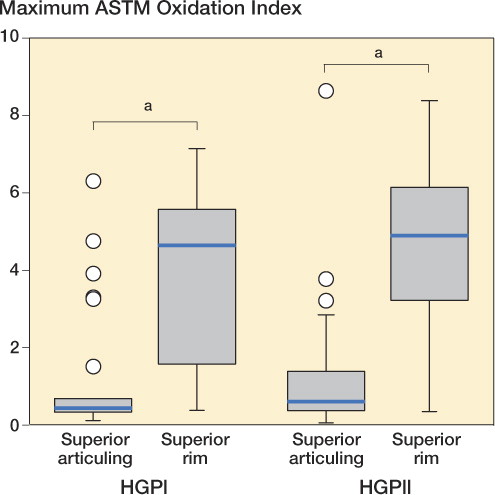
Figure 4. A. Maximum ASTM oxidation index vs. implantation time for the superior articulating surface and the rim for both cohorts combined. At the articulating surface, the oxidation index was negatively correlated with implantation time (Spearman’s Rho = –0.29; p = 0.005). No correlation was observed between the oxidation index at the rim and implantation time (Spearman’s Rho = –0.01; p = 0.9). B. Maximum ASTM oxidation index vs. implantation time plus shelf life for the superior articulating surface and the rim for both cohorts combined. At the articulating surface, the oxidation index was negatively correlated with implantation time plus shelf life (Spearman’s Rho = –0.24; p = 0.05). No correlation was found between the oxidation index at the rim and implantation time plus shelf life time (Spearman’s Rho = –0.099; p = 0.4).
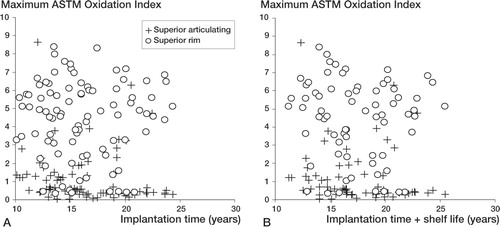
Figure 5. Box plots of the maximum ASTM oxidation index at the rim in liners with no subsurface cracking or fracture, subsurface rim cracking (type 1), and partial or complete rim fracture (types 2 or 3) for the 2 cohorts combined.
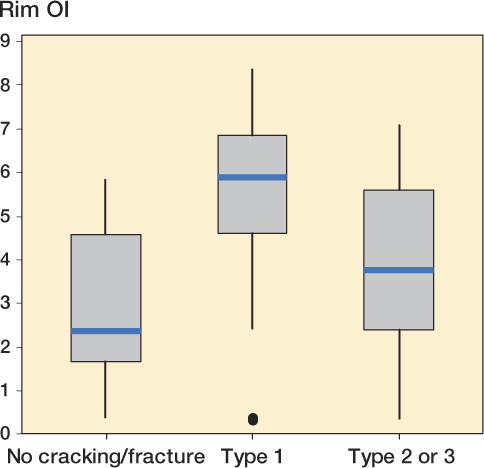
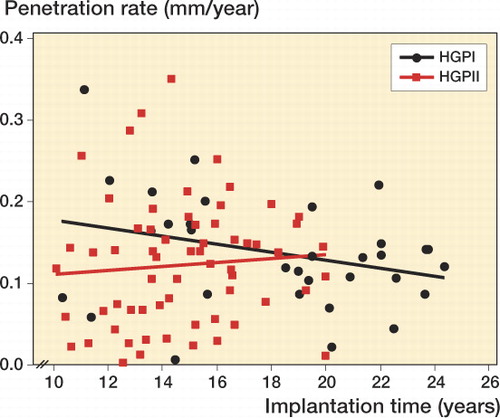
Figure 6. Linear penetration rate vs. implantation time (black circles: HGPI; red squares: HGPII).