Figures & data
Table 1. Patient and procedure characteristics for the primary THAs included, and number of primary THAs excluded over the 3 time periods
Table 2. Relative risk of revision due to infection of primary THAs in the NARA with 1-16 years of follow-up. Adjusted for age, sex, diagnosis, prosthesis, and cement
Figure 1. Adjusted cumulative revision rates for THAs revised due to infection in 3 time periods of primary surgery, for all THAs (upper left panel) and 5 subgroups of THAs. Adjusted for age, sex, diagnosis, prosthesis, and cement. *Adjusted for age and sex only.

Figure 2. Graphical display of the relationship between year of primary surgery and relative risk of revision due to infection (with 95% CI), for all THAs (upper left panel) and 5 subgroups of THAs. The broken lines represent no difference in relative risk from the beginning of the period (RR = 1). Adjusted for age, sex, diagnosis, prosthesis, and cement. *Adjusted for age and sex.
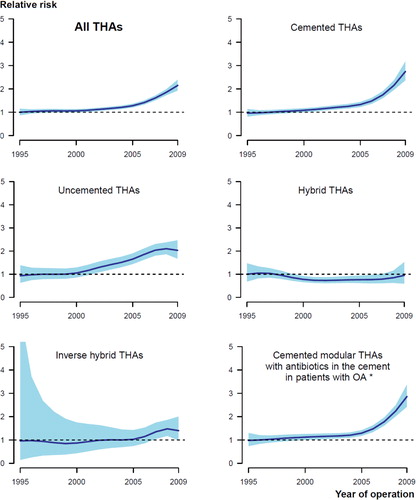
Table 3. Adjusted cumulative 5-year revision rates of primary THAs in the NARA. Adjusted for age, sex, diagnosis, prosthesis, and cement
Table 4. Adjusted relative risks of revision due to infection for 4 different time intervals after primary surgery, for the 3 time periods. Adjusted for age, sex, diagnosis, prosthesis, and cement
Figure 3. A graphical display of the relationship between relative risk of revision due to infection and time after primary THAs for the period 2000–2004 (left panel) and 2005–2009 (right panel) compared to 1995–1999 (blue lines). Smoothed Schoenfeld residuals adjusted for age, sex, diagnosis, prosthesis and cement (solid lines) with 95% confidence intervals (broken lines).
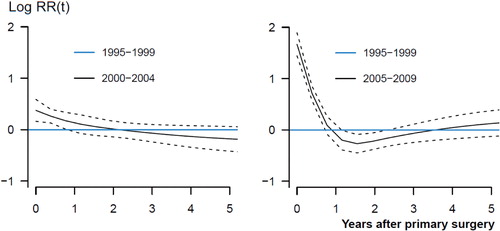
Table 5. Adjusted relative risks and adjusted cumulative 5-year revision rates for risk factors for revision due to infection. All risk factors were adjusted mutually for the other risk factors in addition to the year of primary surgery. Follow-up in the risk analyses was 1-16 years