Figures & data
Figure 1. A. Toll-like receptors TLR1, TLR2, and TLR9 in 4 primary chondrocyte isolates. B–D. 4 mesenchymal stem cell lines (day 0) differentiating via a progenitor stage (days 7 and 14) to chondrocytes (day 21). Quantitative real-time polymerase chain reaction was used to measure the mRNA copy numbers per 106 β-actin copies. In primary chondrocyte isolates, TLR1 and TLR2 mRNA levels were higher than TLR9 mRNA levels († p < 0.001). Overall changes in TLR2 and TLR9 mRNA expression were significant during chondrogenesis.
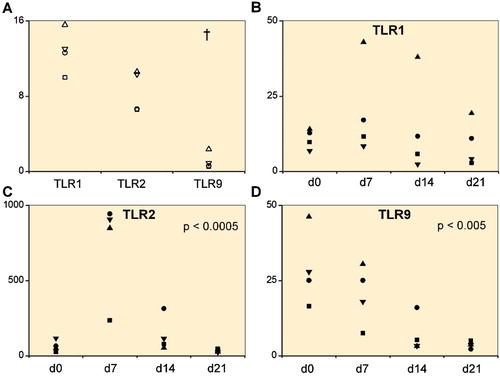
Figure 2. Chondrocyte pellets at day 21 produced from human bone marrow-derived mesenchymal stem cells. A–D. Immunostaining of TLR1 (panel A), TLR2 (panel B), and TLR9 (panel C) compared to negative staining control (panel D). Magnification 200×. E–G. Collagen type-II immunostaining (Collagen II, panel E) and Safranin O staining of untreated 3D chondrocyte pellets (control, panel F) compared to pellets treated with 5 ng/mL TNF-α (panel G) and 100 ng/mL TNF-α (panel H) (showing dose-dependent depletion of proteoglycans in the presence of TNF-α). Magnification 100×.
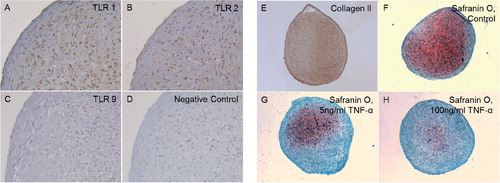
Figure 3. Folds of change in tumor necrosis factor-α (TNF-α) expression and TLR1, TLR2, TLR4, and TLR9 expression upon stimulation with TLR 1/2-specific ligand Pam 3CSK4. Primary 2D chondrocyte cultures (A) and 3D chondrocyte pellet cultures (B) at day 21 (i.e. produced from human mesenchymal stem cells at day 21). † p ≤ 0.05 compared to unstimulated cultures.
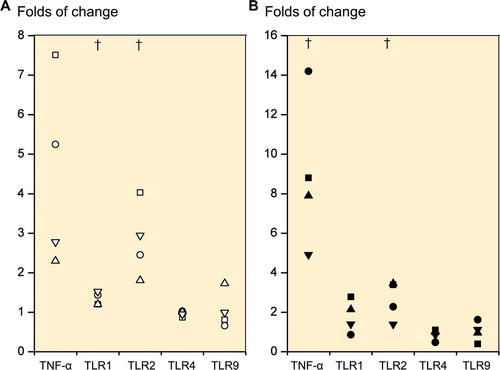
Figure 4. Folds of change in tumor necrosis factor-α (TNF-α), TLR1, TLR2, TLR4, and TLR9 upon stimulation of primary 3D chondrocyte pellet cultures. Stimulation with 5 ng/mL TNF-α (A) and with 100 ng/mL TNF-α (B). † p ≤ 0.05. All statistical comparisons were against unstimulated cultures (normalized to 1).
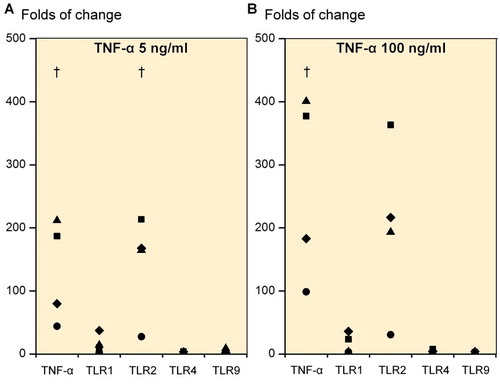
Figure 5. Collagenase-cleaved COL2A-3/4M neoepitope immunostaining of 3D chondrocyte pellets. Untreated 3D-chondrocyte pellets (A) and the negative staining control (B). 3D chondrocyte pellets stimulated with 5 ng/mL TNF-α (C) and 100 ng/mL TNF-α (D). Magnification 100×.
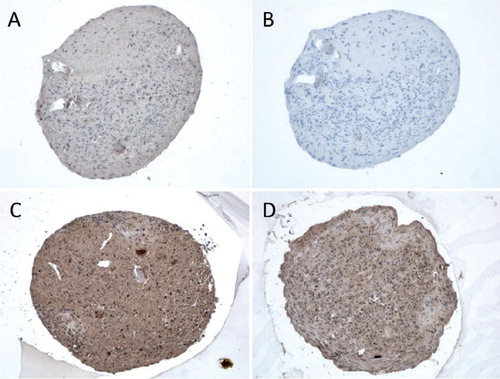
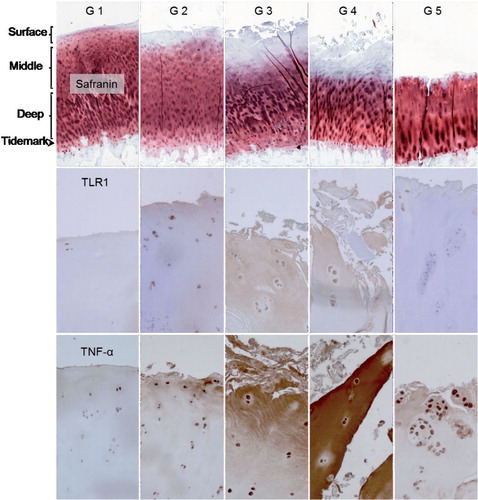
Figure 6. Safranin O, TLR1, and TNF-α staining of OARSI-graded osteoarthritis samples (grades G1–G5). TLR2 and TLR9 immunostaining was rather similar to that of TLR1 and is shown in Supplementary figure. Surface (tangential, gliding), middle (transient), and deep (radial) zones are marked, and also tide mark (between cartilage and calcified cartilage) and subchondral bone. The safranin O microphotographs are panoramic images, constructed from several microphotographs to provide an overall view of all zones in one image. Magnification 100×.
Histomorphometric evaluation of progenitor cell marker CD166 and Toll-like receptors 1 (TLR1), 2 (TLR2), and 4 (TLR4) in OARSI-graded grade 1–5 osteoarthritis (OA) samples. Proportions of positively stained cells (%) in the surface (S), middle (M), and deep zones (D) are given. Because the surface zone was totally worn off in all G5 OA samples, no value is given for this zone in grade-5 OA samples. Mean and SD