Figures & data
Figure 1. Shoulder prosthesis mounted in 2 different positions in a CT scanner. Humeral component placed against an all-polyethylene glenoid component and the prosthesis aligned perpendicularly (left part of figure) and axially (right part of figure) relative to the axis of the scanner. The opening of the CT scanner is shown, and indicates the orientation of the specimen relative to the scanner. The glenoid component was fixed into a box using PMMA bone cement. The bottom part of the figure shows CT scan images of the artificial total shoulder replacement oriented perpendicular to, and parallel to, the 2D CT acquisition plane. The green arrows in the figure indicate the orientation of the scanner, by which the alignment of the implant with respect to the CT acquisition plane can be evaluated.
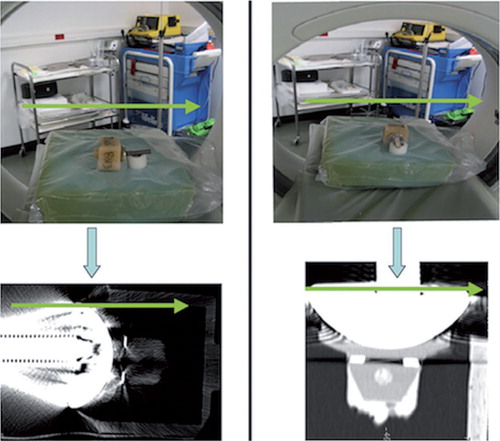
Figure 2. Position of the patient in the CT scanner as used in this study: patient in lateral decubitus or in three-quarter decubitus, allowing the scapula to tilt, with shoulder in maximal flexion.
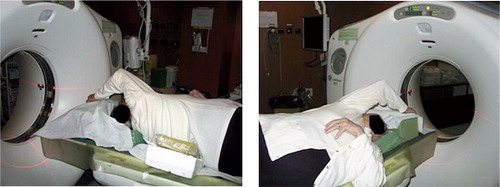
Figure 3. Coronal and sagittal scout views of the shoulder with the most severely limited active flexion angle of the series and also indicating the angle (non-ideal alignment) between the glenoid orientation and the CT-scan acquisition plane.
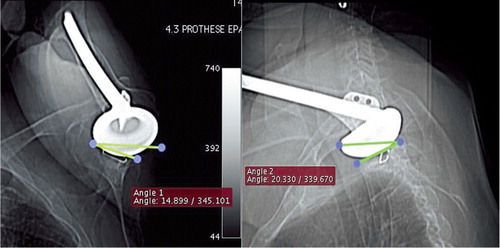
Table 1. CT settings (64-bit data acquisition system; Light Speed VCT; GE)
Figure 4. Radiolucent line at the cement-bone interface (black arrows) visualized by using the described protocol, in the sagittal plane of the glenoid implant (a), in the axial plane of the middle part of the implant (b), in the coronal plane of the implant, passing through the keel hole (c). Plain radiograph of the same shoulder for comparison (d).
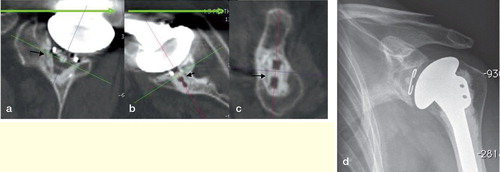
Figure 5. Coronal view of the glenoid bone including the implant. The numbers indicate the 6 zones used in the Molé Score to assess the level of radiolucent lines in the fixation of the glenoid component. Each zone is scored between 0 and 3 points according to the level of radiolucent lines observed and the Molé Score is the sum of these scores.
Zone 1: fixation area of the superior part of the glenoid component base plate;
Zone 2: fixation area of the superior part of the keel;
Zone 3: fixation area of the tip of the keel;
Zone 4: fixation area of the inferior part of the keel;
Zone 5: fixation area of the inferior part of the glenoid component base plate;
Zone 6: fixation area of the central part of the glenoid component base plate.
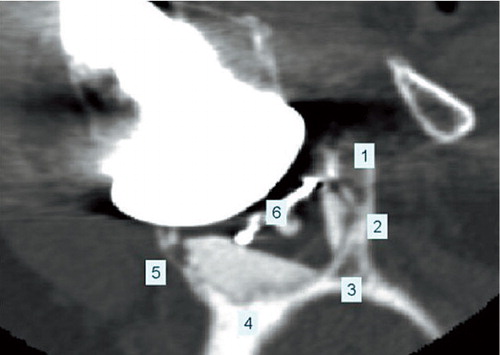
Table 2. Comparison of plain radiographs and CT scan results from 55 observations in total (11 patients each observed by 5 observers)
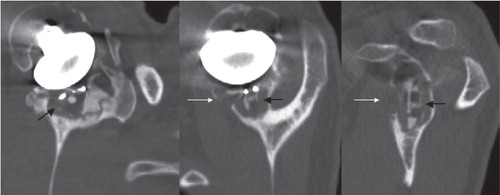
Figure 6. Cancellous bone osteolysis (indicated by the black arrows) and cortical bone osteolysis (indicated by the white arrows) visualized using the described protocol, in the sagittal plane of the glenoid implant (left), in the axial plane of the middle part of the implant (middle), in the coronal plane of the implant, passing through the keel hole (right).