
Figures & data
Table 1. Patient data
Table 2. Validity, reliability, and measurement error of 4 different questionnaires evaluating patients with forefoot disorders. Correlation analyses compared SEFAS with the other questionnaires. Data are presented as mean with 95% confidence interval (CI), as standard deviation (SD), or as percentage (%). Agreement is presented as Smethod with CV% witihin brackets
Table 3. Validity, reliability, and measurement error of 4 different questionnaires evaluating patients with hindfoot or ankle disorders. Correlation analyses compared SEFAS and the other questionnaires. The time it took to complete the questionnaires is presented for the different questionnaires. Data are presented as mean with 95% confidence interval (CI), as standard deviation (SD), or as percentage (%). Agreement is presented as Smethod with CV% witihin brackets
Agreement in scores of patients with forefoot disorders (n = 37) and of patients with hindfoot or ankle disorders (n = 52) for SEFAS presented as Bland-Altman plots (Bland and Altman 1986). The solid line represents the mean value and the dotted lines show the limits for 2 standard deviations (SDs) above and below the mean value.
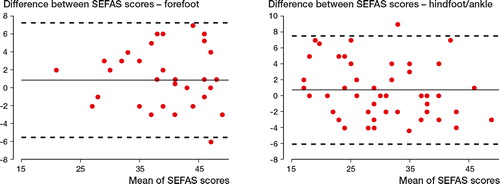
Table 4. Pre- and postoperative values in 68 patients operated due to forefoot disorders, with responsiveness expressed as effect size (ES) and standardized response mean (SRM). Data are presented as mean with 95% confidence interval. Due to missing answers in some questionnaires, the numbers of fully filled questionnaires are presented in parentheses in the left-hand column (n)
Table 5. Pre- and postoperative values in 68 patients operated on due to hindfoot or ankle disorders, with responsiveness expressed as effect size (ES) and standardized response mean (SRM). Data are presented as mean with 95% confidence interval. Due to missing answers in some questionnaires, the numbers of fully filled questionnaires are presented in the left-hand column (n)