Figures & data
Figure 1. The study design and the positioning of the bone defects.
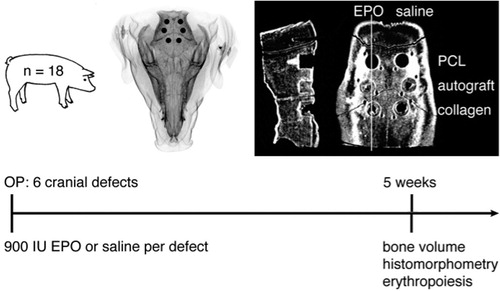
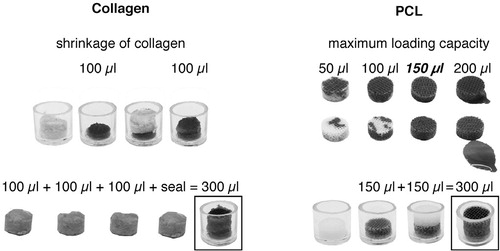
Figure 2. The maximum loading volumes of 100 µL in collagen and 150 µL in PCL scaffolds, and the optimal insertion procedure, were tested in pilot experiments. The sequential insertion and pipetting procedure that was used during the operation is depicted at the bottom of the figure. This procedure assured that there was an even distribution of EPO throughout the collagen carrier and the PCL scaffold.
Results of histomorphometrical analysis: median tissue area fraction (range) and coefficient of variance (CV) in percent
Figure 3. The Bioscaffolder (A) that produced PCL mates from which the PCL scaffolds (10 mm in diameter) were punched (B). Bioscaffolding resulted in a 3-dimensional network of PCL fibers, deposited layer by layer. [Authors: no hyphens here; not an adjective] The individual strands and gaps of the scaffolds were aligned and they were of similar size. This is illustrated by the scanning electron microscopy image (C). Scale bar: 500 µm.
![Figure 3. The Bioscaffolder (A) that produced PCL mates from which the PCL scaffolds (10 mm in diameter) were punched (B). Bioscaffolding resulted in a 3-dimensional network of PCL fibers, deposited layer by layer. [Authors: no hyphens here; not an adjective] The individual strands and gaps of the scaffolds were aligned and they were of similar size. This is illustrated by the scanning electron microscopy image (C). Scale bar: 500 µm.](/cms/asset/090dc56e-4434-45f4-9b9b-8329d12465f4/iort_a_889981_f0003_b.jpg)
Figure 4. Graphic depiction of BV/TV results assessed with HR-QCT scans (82 µm3 voxel size). Overview of normal calvarial bone, which was used as a reference (ref.) and pairwise comparisons of saline-treated control defects with EPO-treated defects in conjunction with either autograft, a collagen carrier, or a PCL scaffold.
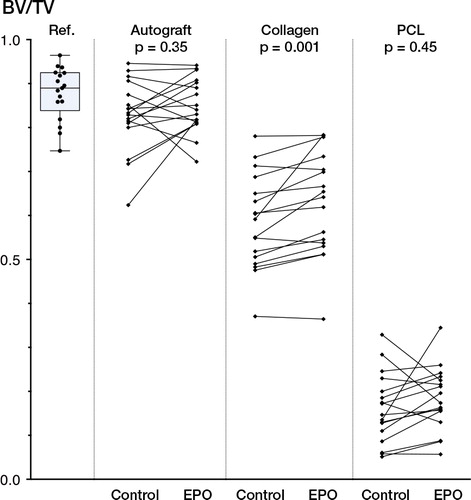
Figure 5. Histological specimens exemplifying the characteristic healing patterns for the 3 groups: autograft (A), collagen carrier (B), and PCL scaffold (C). The intended FAVER section is illustrated in C, where a hyper-dense groove after the centripetal Kirschner wire can be seen. Because no statistically significant differences were found with histomorphometry, random sections with or without EPO are shown.
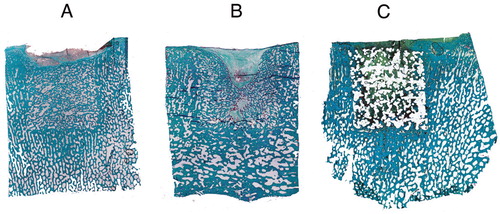
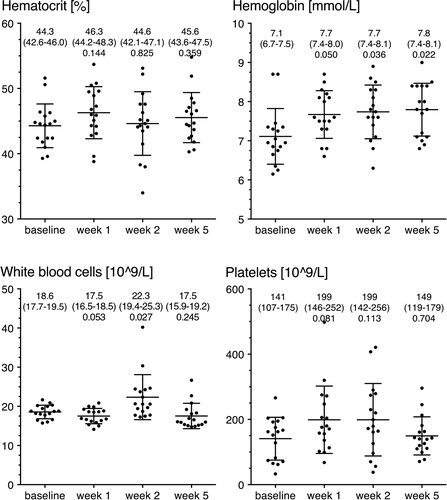
Figure 6. Hematological quantities. The figure shows hemoglobin levels, hematocrit, platelet count, and white blood cell count at baseline and after postoperative weeks 1, 2, and 5. Data are shown as mean ± SD as error bars. Mean, 95% CI, and uncorrected p-value against baseline are given above the graphs. None of the differences were found to be statistically significant following correction for multiple comparisons.