Figures & data
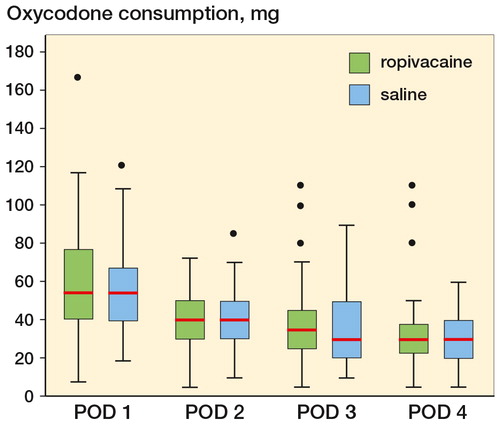
Figure 1. Flow chart of patients
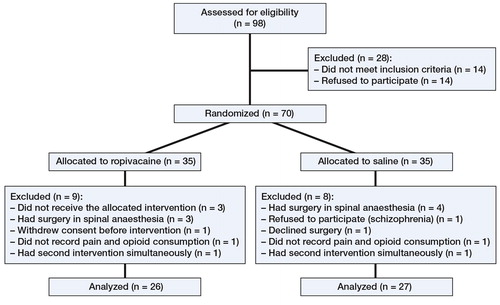
Table 1. Criteria for inclusion and exclusion
Table 2. Characteristics of 53 patients randomized to receive postoperative wound infiltration of either ropivacaine or placebo (saline). Values are median (range) or number
Table 3. Postoperative pain and timed up-and-go (TUG) results. Values are mean (SD) or number of registrations in the 2 groups. Self-reporting of pain at rest was scheduled 4 times every day. Pain during activity was assessed once a day, immediately after the TUG test
Figure 2. Boxplot showing median oxycodone consumption postoperative day (POD) 1–4. POD 1: p = 0.66, POD 2: p = 0.86, POD 3: p = 0.57, and POD 4: p = 0.85. Boxes indicate median with 25th and 75th percentilrs and whisker caps indicate 10th and 90th percentiles. Dots show each observation outside whiskers.