Figures & data
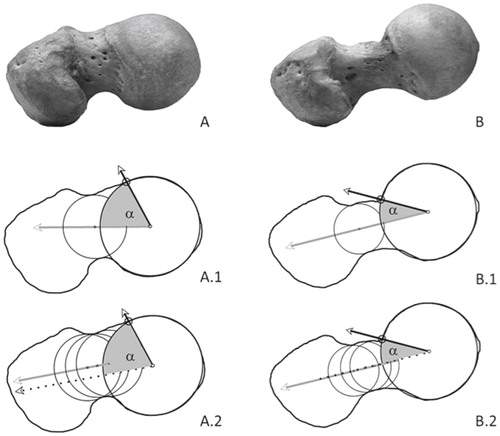
Figure 1. 3-point and anatomic method compared in high alpha angle (A) and low alpha angle (B). 3-point method (A.1 and B.1) uses the midpoint of the femoral neck at its narrowest point. The anatomic method (B.2 and B.2) defines the femoral neck axis by connecting the centers of 3 circles projected over the neck contour. The axis is translated to the center of the femoral head if necessary, to measure the alpha angle. In this example, alpha angle A.1 = 64˚, A.2 = 73˚. Angle B.1 and B.2 are both 30˚, while the femoral head is positioned central on the femoral neck.
Measurements in 155 cross-table radiographs
Figure 2. Bland-Altman plot of the measurements of cadaver photographs. The x-axis depicts the average of 2 measurements for each cadaver femur. The y-axis depicts their difference (anatomic minus 3-point).
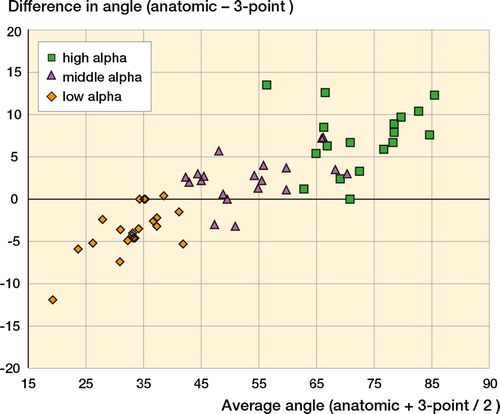
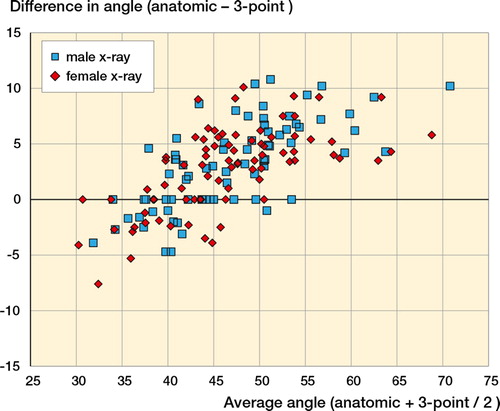
Figure 3. Bland-Altman plot of the measurements of radiographs. The x-axis depicts the average of 2 measurements for each cadaver femur. The y-axis depicts their difference (anatomic minus 3-point).