
Figures & data
Table 1. Overview of the evolution of the Swedish population from 1970 to 2010 and the official forecast for 2020 and 2030
Figure 1. Annual number of total hip replacements registered in Sweden, 1968–2012.
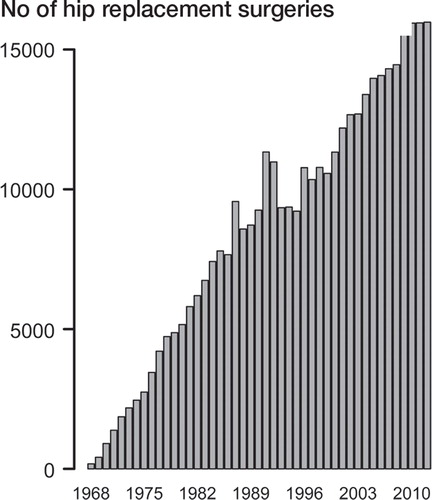
Figure 2. The recorded and projected incidence of total hip arthroplasty per 105 Swedish residents aged 40 years or older, 2013–2040. A. Projections based on Poisson regression. B. Projections based on asymptotic modeling, with the gray horizontal line representing the estimated asymptote and the associated 95% confidence intervals of the best model; asymptotic regression.
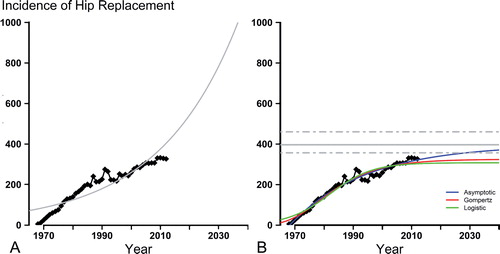
Table 2. Prognosis for the evolution of the Swedish population between 2013 and 2030: the expected number and proportion of Swedish residents aged 40 years and older together with the predicted incidence per 105 Swedish residents aged 40 years and older and the expected number of total hip replacements (THRs) in Sweden as predicted by asymptotic regression