
Figures & data
Table 1. Patient characteristics in the different groups (primary total hip arthroplasty and primary total knee arthroplasty; revision total hip arthroplasty and revision total knee arthroplasty)
Figure 1. Participants from inclusion until 1–year follow–up.
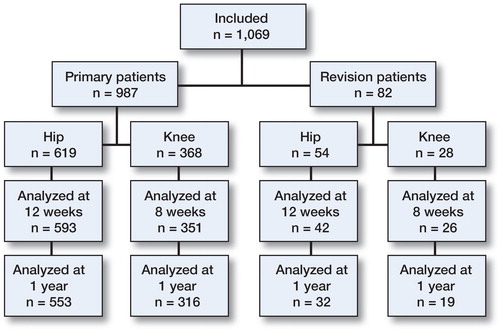
Figure 2. Pain at rest (upper panel) and mobilization (lower panel) at 8 time points, from preoperatively until 1 year postoperatively. Lines represent mean pain score for each patient group.
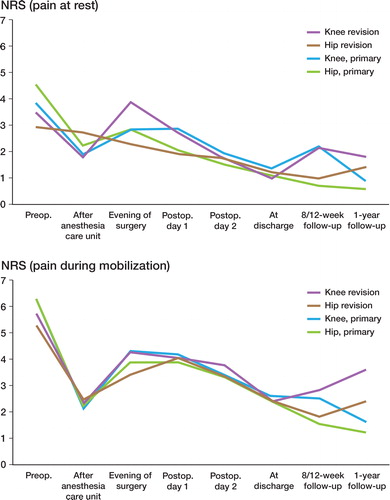
Table 2. Patient–reported outcome scores (PROMS) in the 4 different groups: EQ–5D, HOOS–PS, KOOS–PS, and the physical function scores HHS and KSS. For abbreviations, see text. All scores were obtained preoperatively, 8 and 12 weeks postoperatively, and 1 year postoperatively. Data are mean (SD)
Table 3. Complications within 1 year of primary total hip arthroplasty or primary total knee arthroplasty
Table 4. Complications within 1 year of revision surgery for hip and knee patients