Figures & data
Table 1. Distribution of implant patterns
Figure 1. Characteristics of bone marrow-derived MSCs. Panel (a) demonstrates the colony-forming properties of MSCs isolated from bone marrow of cynomolgus macaques using the present protocol (arrows). Bar: 1 cm. Panel (b) shows the adipogenetic properties of MSC-derived cells from staining of lipid droplets with oil red O (arrowheads). Bar: 20 μm. Panel (c) confirms the osteoblastic properties of MSC-derived cells with alkaline phosphatase staining (arrowheads). Bar: 30 μm. Panel (d) confirms the chondrogenetic properties from immunostaining of type-II collagen. Type-II collagen-positive matrix is stained red. Bar: 0.5 mm.
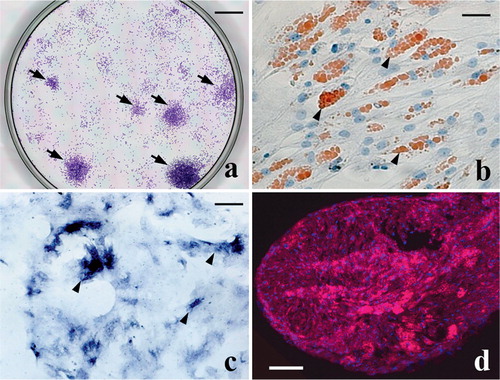
Figure 2. Macroscopic observations of the repaired defects in the 3 groups at 6 weeks (a, d, g), 12 weeks (b, e, h), and 24 weeks (c, f, i) after implantation. Scale bar: 5 mm. Arrow in (d): the sharp edge of the defect is visible at 6 weeks in the gel group. Arrow in (f): a hollow-like deformity remains in the central region of the defect, despite thick coverage by the reparative tissue. Arrow in (g): the sharp edge of the defect is also visible in the MSC group at 6 weeks.
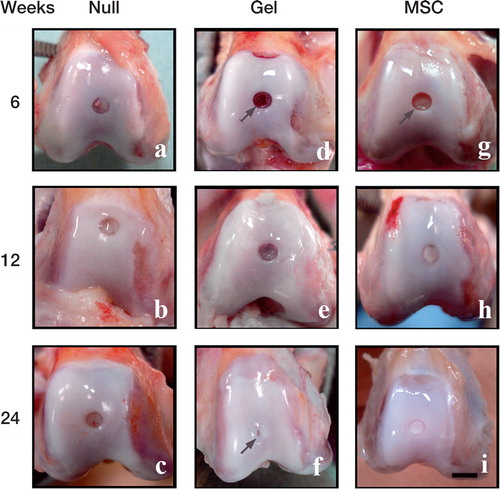
Figure 3. Histological findings after toluidine blue staining in the 3 groups at 6 weeks (a, d, g), 12 weeks (b, e, h), and 24 weeks (c, f, i) after implantation. Scale bar: 2 mm. Dotted line in (a): amorphous reparative tissue filling the subchondral region. Arrowheads in (b): faint toluidine blue staining that reflects involvement of endochondral ossification. Arrowhead in (c): toluidine blue-negative reparative tissue covering the defect. Dotted line in (c): reconstructed subchondral bone consisting of woven bone-like structure. Arrowhead in (d): toluidine blue-positive cartilaginous tissue. Arrowhead in (e): thin faintly toluidine blue-positive layer covering the defect. Arrowhead in (f): the unstained central region of the cartilaginous layer covering the defect. Arrow in (f): excessive cartilage extruding through the deficient tidemark. Dotted line in (g): woven bone-like subchondral bone already re-appearing at 6 weeks. Arrowhead in (h): reconstructed tidemark distinctly discriminating the articular cartilage from the subchondral bone.
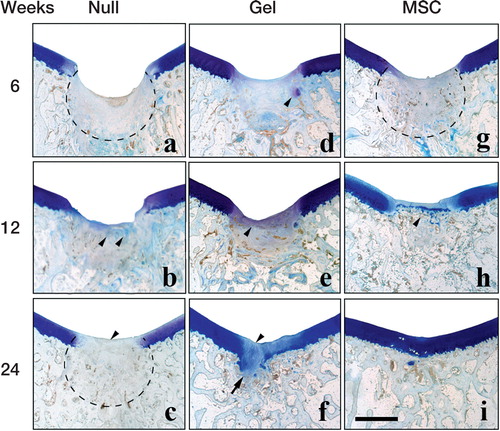
Figure 4. Comparison of all 24-week toluidine blue histology sections. Histological findings after toluidine blue staining of the gel group (a, b, c, d), the null group (e, f, g, h), and the MSC group (i, j, k, l). Scale bar: 3 mm.
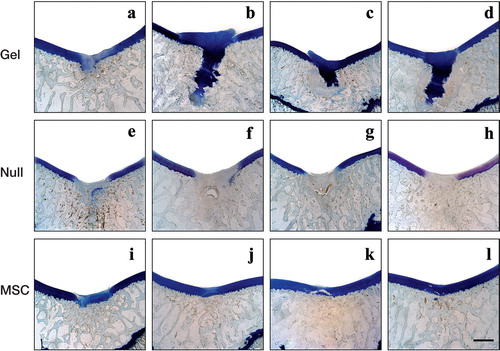
Table 2. Percentage of new cartilage area in the experimental groups. Values are median (interquartile range)
Figure 5. Histological findings after immunohistochemistry for type-I collagen (a, b, c) and type-II collagen (b, d, f) in the 3 groups 24 weeks after implantation. Scale bar: 2 mm. Immunopositive staining is brown, and immunonegative matrix is stained purple. Arrowhead in (a): intensely collagen type-I positive repair tissue covering the defect. Arrowhead in (b): collagen type-II-void reparative tissue covering the defect. Arrowhead in (c): very faint collagen type-I positivity in the repair tissue. Arrow in (c, d): excessive cartilage extruding through the deficient tidemark. Arrowhead in (d): partly positive collagen type-II immunoreactivity in the repair tissue. Arrowheads in (e, f): formation of distinct tidemark discriminating the articular cartilage and subchondral bone consisting of lamellar bone.
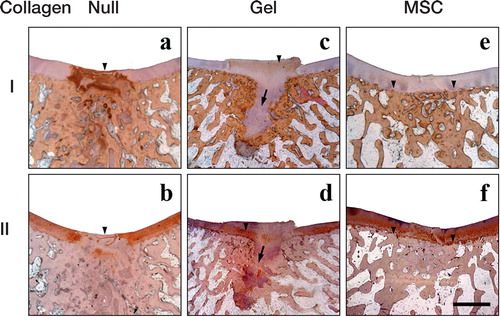
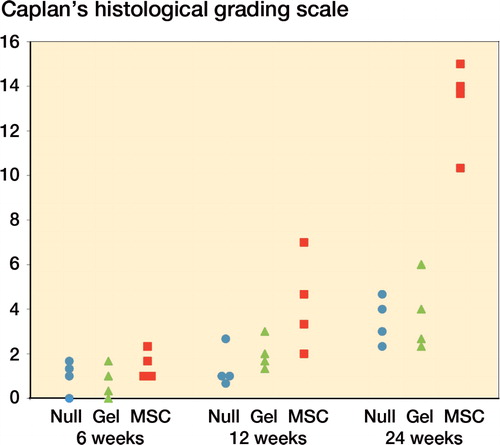
Figure 6. Qualitative histological evaluation by Caplan’s histological grading scale. The qualitative histological scores of the MSC group were significantly higher than those of the other 2 groups at 24 weeks (p < 0.05). There were no significant inter-observer differences in this histological grading.