
Figures & data
Figure 1. The study protocol.
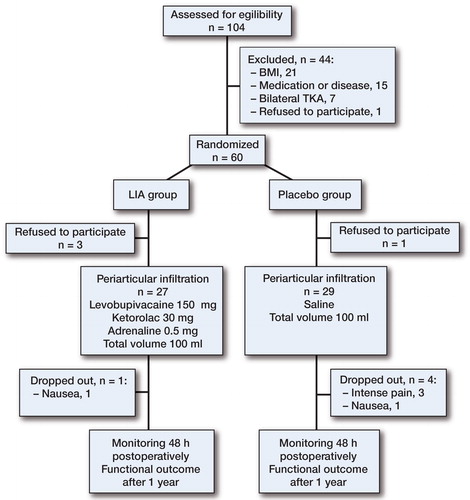
Table 1. Patient demographic data. Data are mean (SD), number, or median (range)
Figure 2. Median cumulative consumption of oxycodone over 48 h postoperatively. 6 h: p = < 0.001; 12 h: p = < 0.001; 24 h: p = 0.03; 48 h: p = 0.03. The Bonferroni-adjusted p-value for the 48-h time point was 0.1. The line in the middle of the box represents the median. The lower and the upper edges of the box are the 1st and 3rd quartile, respectively. If an observation is beyond 1.5 times interquartile range it is considered as an outlier and marked by a dot. Whiskers are the lowest and highest values that are not outliers.
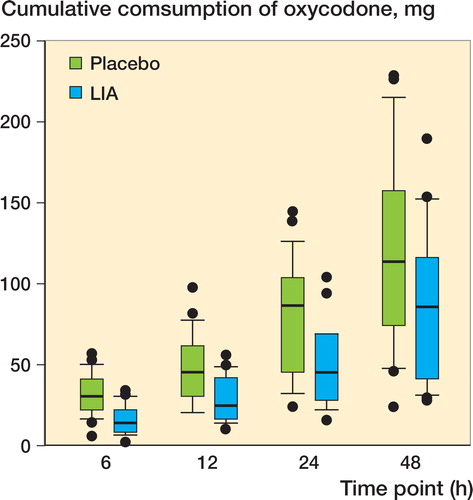
Figure 3. Consumption of oxycodone in different time intervals. Consumption is presented as median with 25th and 75th percentiles. 0–6 h: p < 0.001; 6–12 h: p = 0.09; 12–24 h: p = 0.1; 24–48 h: p = 0.4. For the 0–6 h interval, the Boniferroni adjusted p-value was < 0.001.

Figure 4. Postoperative pain at rest. VAS scores are presented as median with 25th and 75th percentiles. 3 h: p = 0.4; 9 h: p = 0.2; 18 h: p = 0.4; 48 h: p = 0.5.
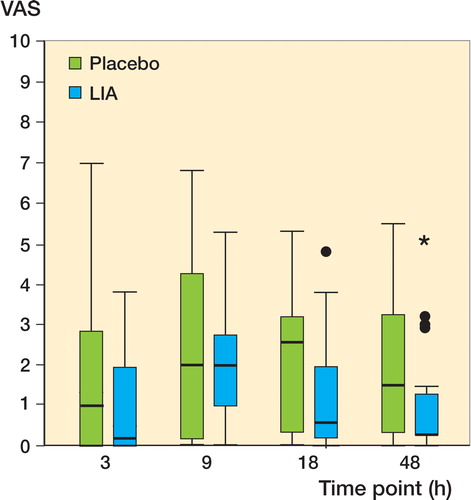
Figure 5. ROM at measured time point. ROMs are presented as median with 25th and 75th percentiles. 6 h: p = 0.001; 24 h: p = 0.08; 48 h: p = 0.6. The Bonferroni-adjusted p-value for the 6-h time point was 0.004.
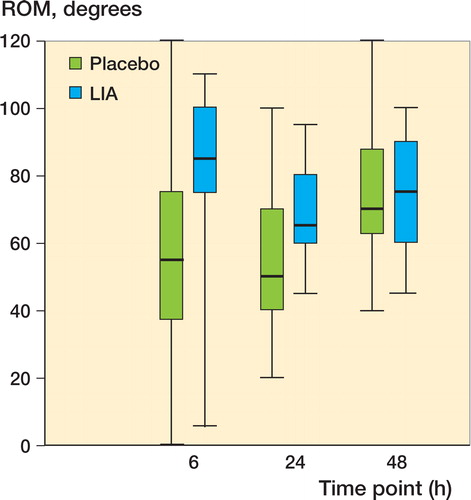
Table 2. Functional and quality-of-life results with 1-year follow-up. Results are mean (SD) and mean difference with 95% CI