Figures & data
Table 1. Objective criteria used to evaluate and compare MARS MRI and CT for the assessment of MOM hips
Table 2. Comparable pseudotumor classifications in MARS MRI and low-dose 3-D CT
Table 3. Comparable muscle atrophy classification in MARS MRI and low-dose CT
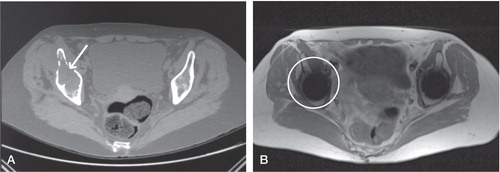
Figure 1. Patient 6. Type-2a lesion (indicated by arrow) classified on MARS MRI scan (A) but lesion cannot be seen on the equivalent CT scan (B). The high attenuation coefficient of the metal implant on CT has led to significant scatter obscuring much of the periprosthetic anatomy, further compounded by a less clear distinction of soft tissues with this modality.
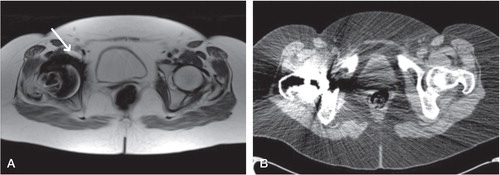
Figure 2. Large pseudotumor (circled) clearly visible on both MARS MRI scan (A) and CT scan (B), as the anatomy of the affected side is grossly distorted when compared to the contralateral, asymptomatic hip.
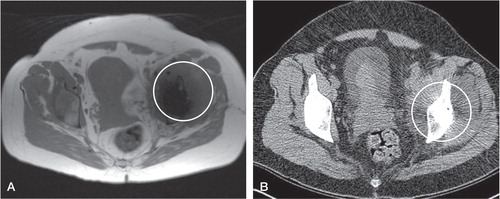
Figure 3. Patient 13. All muscles visualized on MARS MRI scan (A), but obturator externus (OE) (labelled on left and circled on right) could not be seen on the equivalent CT scan (B) despite being viewed in a soft tissue window.
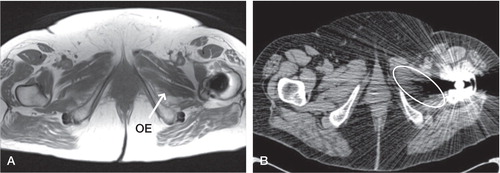
Figure 4. Comparison of the CT image (A) and the MARS MRI image (B) used to evaluate osteolysis in the same patient illustrates the comparative difficulties in identifying acetabular anatomy on MRI images, which are clear on the corresponding CT image. There is an absence of signal on MRI in this region. Coupled with the inferior bony distinction on MRI, this has prevented the identification of osteolytic changes—which are clear on CT (see arrow).