Figures & data
Figure 1. CONSORT 2010 flow diagram.
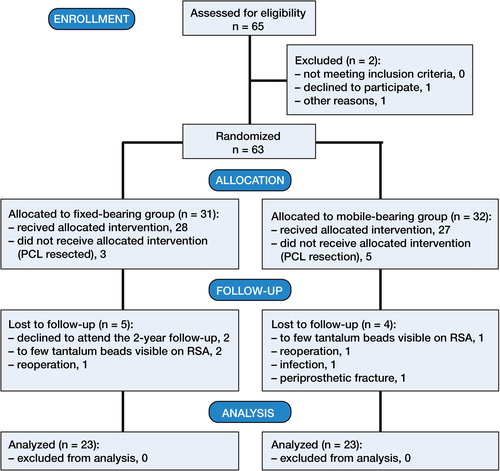
Table 1. Baseline demographics. Values are mean (range)
Figure 2. DXA scans showing implant detection, bone borders, and regions of interest (ROIs). A. Anterior/posterior view. B. Lateral view.
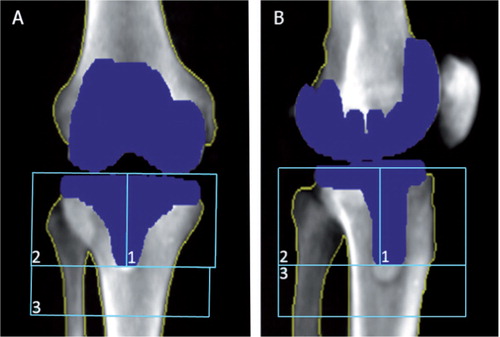
Figure 3. 2-year RSA results. Error bars show SD.
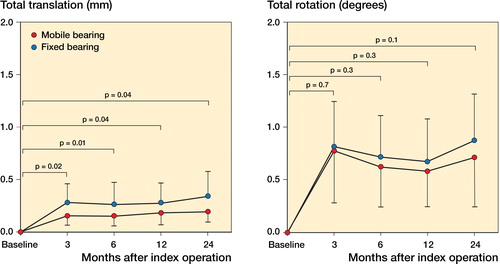
Table 2. Migration results at 24 months
Table 3. Percentage BMD change between baseline, 12-month follow-up, and 24-month follow-up
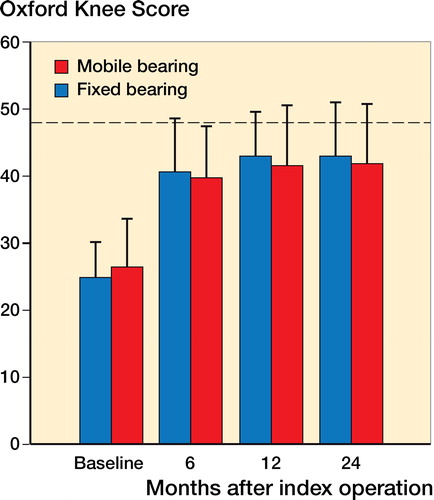
Figure 4. Oxford knee score (min = 12, max = 48). Error bars show SD.