Figures & data
Figure 1. The HEPHAISTOS orthosis.
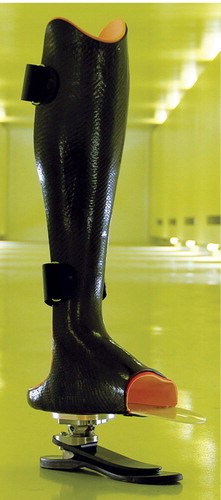
Figure 2. Segmentation of the upper (green) and lower (red) ankle joint (articulatio subtalaris) with a distal and a proximal segment each (panel A), and the knee joint (segments 0–3) (panel B).
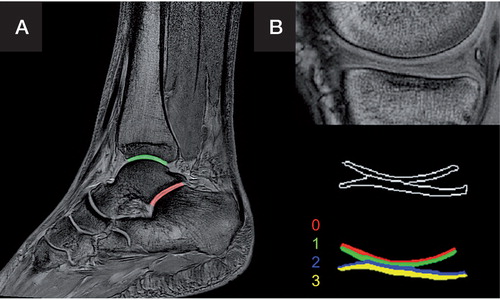
Figure 3. ΔT1 values in the course of the study, in each joint for each volunteer. The baseline measurement was taken before the intervention (baseline data collection, BDC), the second measurement was on day 49 of the intervention (HEPHAISTOS, HEP49), and the third measurement was 14 days after the end of the intervention (recovery, R+14). ΔT1 indicates the GAG content (lower ΔT1 values reflect higher GAG content).
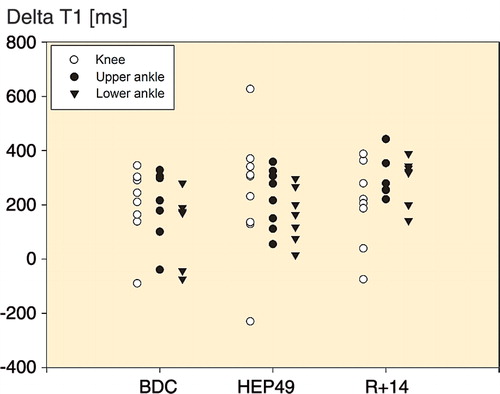
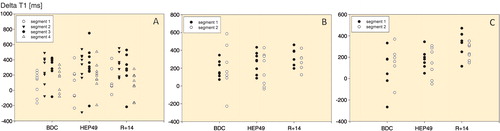
Figure 4. ΔT1 values of the separate segments of the knee joint (A), the upper ankle joint (B) and the lower ankle joint (C) in the individual volunteers throughout the course of the study. In the knee joint, values differ significantly among segments (p < 0.001). ΔT1 indicates the GAG content (lower ΔT1 values reflect higher GAG content).