Figures & data
Figure 1. The study methods, inclusion/exclusion criteria, and study outcomes.
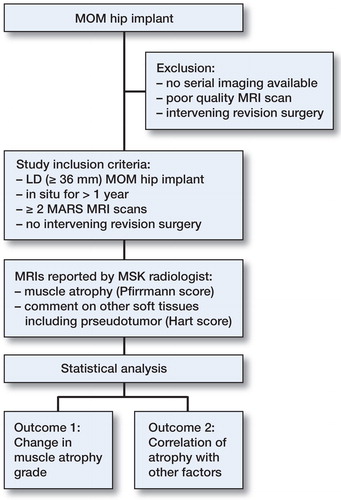
Table 2. MARS MRI protocol
Figure 2. MRI demonstrating increasing grades of muscle atrophy in MOM hip patients. A. Grade 1. B. Grade 2. C. Grade 3. D. Grade 4. Areas of significant atrophy are highlighted with arrows.
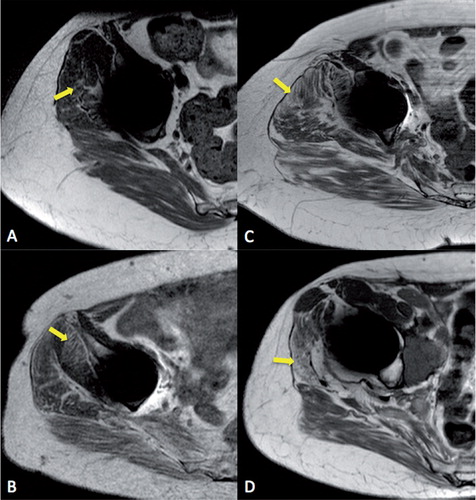
Figure 3. The change in muscle atrophy scores from first MRI (green) to second MRI (blue), where gluteus minimus and posterior and inferior gluteus medius had the greatest mean change between time points.
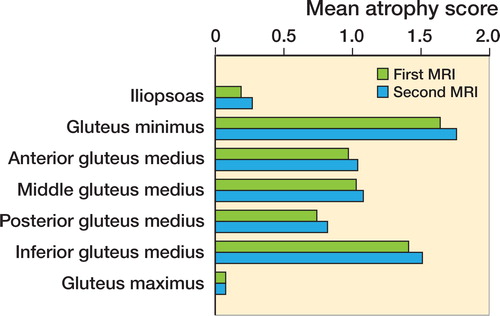
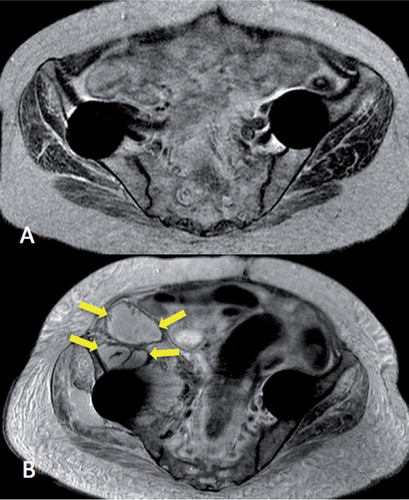
Figure 4. Example of abductor stripping secondary to pseudotumor (marked with arrows). A. Axial image. B. Coronal image. A pseudotumor can be seen traversing the posterior hip around the greater tuberosity onto its lateral aspect, which is now void of abductor tendon insertion.
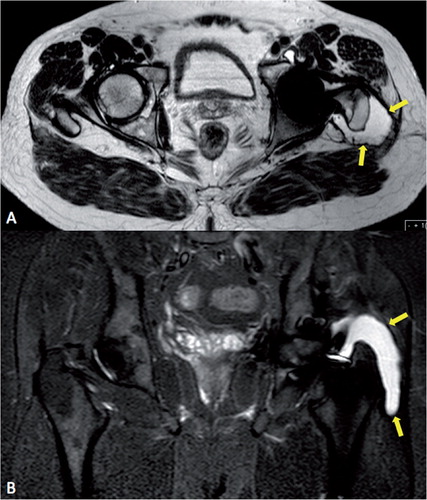
Figure 5. Example of new pseudotumor formation (arrows) in a patient with bilateral Birmingham hip resurfacing. T2-weighted MRI images. Date of implantation was January 2007, time from operation to first MRI (panel A) was 69 months, and time from operation to second MRI (panel B) was 84 months.