
Figures & data
Table 1. Stem characteristics
Figure 1. The ultra-short stem.
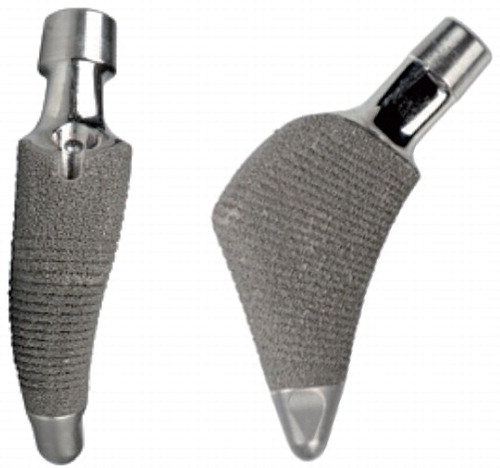
Figure 2. Gruen zones measured from the DXA scanner. Zones 1–2 and 6–7 in the ultra-short stem group were compared to zones 1 and 7, respectively, in the conventional stem group.
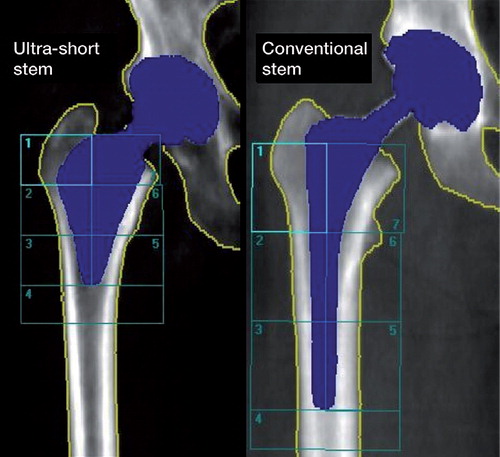
Figure 3. Study protocol. DXAf: DXA scan of proximal femur (WHO total hip); DXAv: DXA scan of vertebrae L1–L4 (WHO lumbar spine); DXAg: DXA scan of Gruen zones; RSA: radiostereometry radiographs; Rad: anterioposterior and lateral conventional radiographs; Clin: clinical outcome scores including Harris hip score (HHS), WOMAC, and EQ-5D.
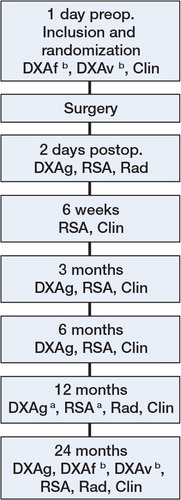
Table 2. Precision of DXA measurements expressed as coefficients of variation in percent (CV%)
Figure 4. Consort flow chart.
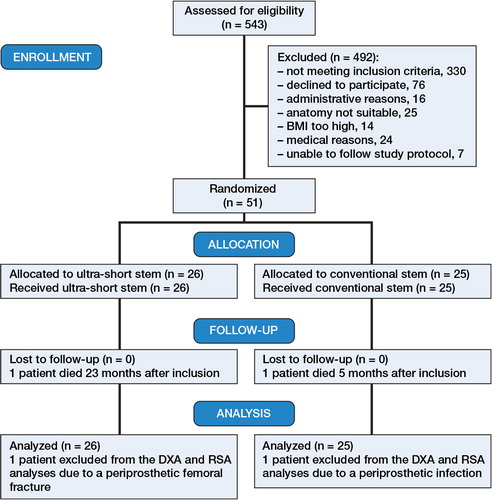
Table 3. Baseline characteristics of the study participants
Table 4. Change (mean (SD) %) in bone mineral density (BMD)
Figure 5. Mean percentage change in BMD. Error bars indicate 95% CI. Differences were analyzed with Student’s t-test. a p < 0.05.
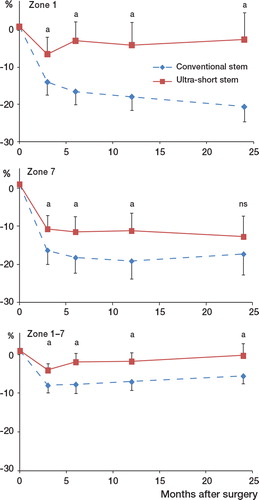
Table 5. Stem migration as maximum total point motion (MTPM) measured with radiostereometry (RSA). Values are median (range) mm.
Figure 6. Stem migration as maximum total point motion (MTPM) for individual stems. Red lines correspond to ultra-short stems and green lines correspond to conventional stems. Solid black line = MTPM ultra-short stems (median). Dashed black line = MTPM conventional stems (median)
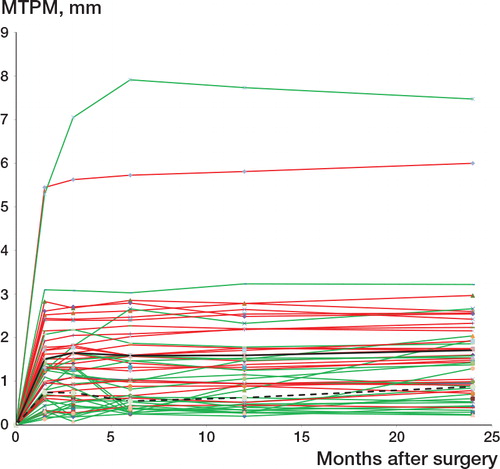
Table 6. Adverse events during the study