Figures & data
Table 1. Experimental groups, implant compositions, and group sizes for each time point
Figure 1. The surgical model and analyses of peri-implant bone formation. Bone marrow ablation was performed through the proximal cortical window (panel A) and the distal vent (B). 2 implants (C) were inserted into the medullary canal. In the µCT analysis, the volume of interest (VOI) (D) was constructed by outlining the endosteal border of the cortex on the cross-sectional images. It was bordered 0.5 mm proximal to and 0.5 mm distal to the ends of the implant (C). The volume of newly formed bone (E) was measured inside the VOI with the volume of the implant deducted. In the histological analysis, the region of interest (ROI 1) was constructed by outlining the endosteal border of the cortex (F). The area of newly formed bone (E) was evaluated inside ROI 1 with the area of the implant (C) deducted. The peri-implant region of interest (ROI 2) was constructed by offsetting the outer border of the implant by 50 µm (G) and deducting the area of the implant (C). The area of peri-implant new bone was evaluated within ROI 2.
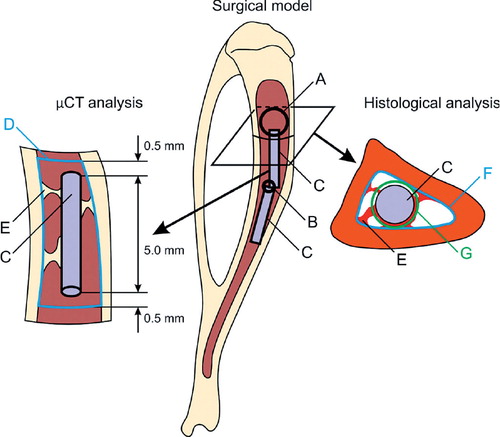
Figure 2. The release rate of ORM-11984 from the PLCL implants containing 10%, 30%, or 50% of the compound (by weight). The in vitro dissolution test had a fixed ORM-11984 dose of 6 mg. This dose required the immersion of 6 implants in the 10% group, 2 implants in the 30% group, and one implant in the 50% group (panel A). When the release rate was normalized against the number of immersed implants, the release rate was dependent on the concentration of the compound (B).
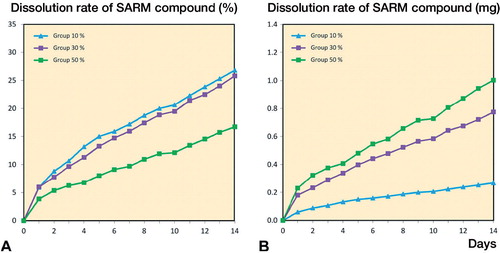
Figure 3. Volumetric µCT analysis of intramedullary new bone showed significant differences between the 3 SARM-treated groups (10%, 30%, or 50% ORM-11984) and the 2 controls at 6 weeks (p = 0.04) and 12 weeks (p = 0.03) (ANOVA with Tukey’s post hoc test). In the box plot presentation, the box denotes the first and third quartiles. The horizontal line inside the bar is the median. The whiskers show the range of the data.
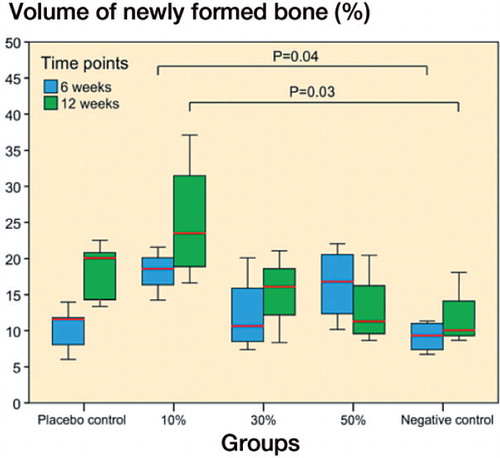
Figure 4. Cross-sectional µCT images and histological sections (van Gieson stain) of rat tibias 6 and 12 weeks after bone marrow ablation and the implantation of polymer (PLCL) implants loaded with 10%, 30%, or 50% ORM-11984. There were 2 control groups: the placebo control (pure PLCL) and the negative control (ablation only).
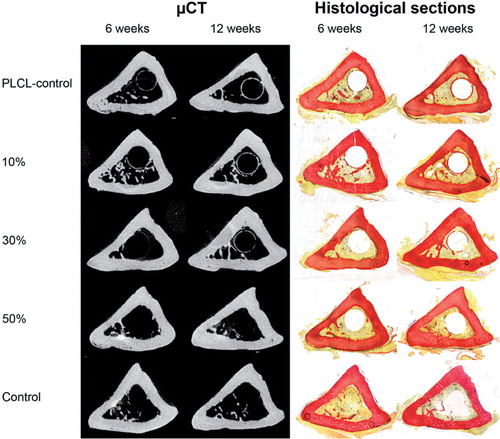
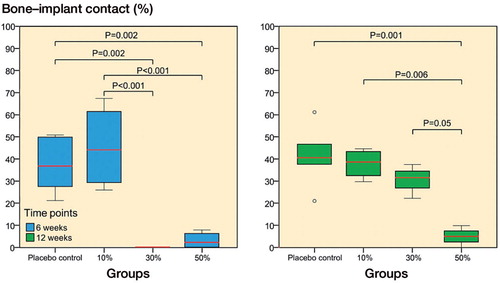
Figure 5. Histomorphometric analysis of new bone in the 50-µm peri-implant ring showed significant differences (ANOVA with Tukey’s post hoc test) between the placebo group and the 3 SARM-treated groups at 6 and 12 weeks (10%, 30%, or 50% ORM-11984). The box plot presentation is explained in Figure 3.
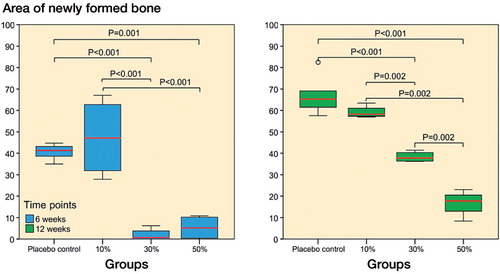
Figure 6. Histomorphometric analysis of bone-implant contact (BIC) showed significant differences (ANOVA with Tukey’s post hoc test) between the placebo group and the 3 SARM-treated groups at 6 and 12 weeks (10%, 30%, or 50% ORM-11984). The box plot presentation is explained in Figure 3.