
Figures & data
Figure 1. Format of gaze-based AT intervention, and time points for data collection (in months), DI (during intervention), B1 (post-intervention), and B2 (follow-up). As expected, the children were provided with local services between B1 and B2, 0–5 occasions to parents (mean 1.9), 1–10 occasions to teachers (mean 3.8).
Table 1. Background variables for participating children.
Figure 2. A personalized first page in the gaze-based AT, from which the child can select a picture with eye gaze to reach more pages with pictures and activities.
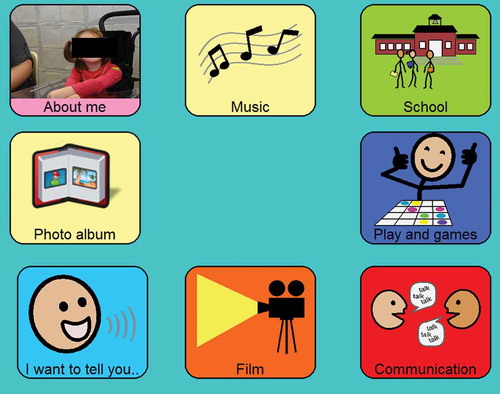
Table 2. Instruments for data collection.
Table 3. Computer activities children performed in home and at school.
Figure 3a. Five of the children with positive change from baseline (A) to post-intervention (B1) and with maintained effect at follow-up (B2), in duration of computer use (black line) and in number of computer activities (red line). Missing days: # due to broken gaze-based AT, * due to that the child was sick.
Primary Y-axis: minutes; secondary Y-axis: number of activities. Black line: duration of computer use. Red line: number of computer activities.
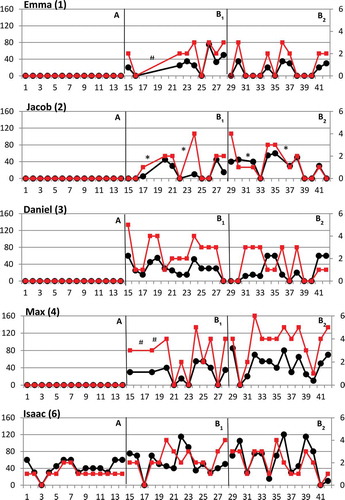
Figure 3b. Two of the children with positive change from baseline (A) to post-intervention (B1) and with maintained effect at follow-up (B2) (7, 10), and three children with no effect over time (5, 8, 9), in duration of computer use (black line), and in the number of computer activities (red line). * Missing days due to that the child was sick.
Primary Y-axis: minutes; secondary Y-axis: number of activities. Black line: duration of computer use. Red line: number of computer activities.
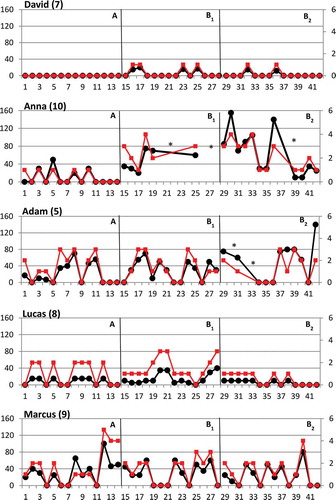
Figure 4. Percentage of days with computer use (%) over time for each child. Three children used a gaze-based AT at baseline (6, 8, 9), one child a head-controlled mouse (5), and one child a switch (10).
Table 4. Description of attained goals for each child.