Figures & data
Figure 1. Location of variable and conserved regions in a typical bacterial 16S rRNA. A) location of variable (Vi, green) and conserved (Ci, pink) regions in a typical bacterial 16S rRNA gene (complete gene). The black bases in C4 are completely invariant in all bacteria. B) Specific example of the C2 to C4 region in Escherichia coli, with a similar color code to A. The C2, C3, and C4 conserved regions are the targets of universal bacterial ribosomal DNA primers.
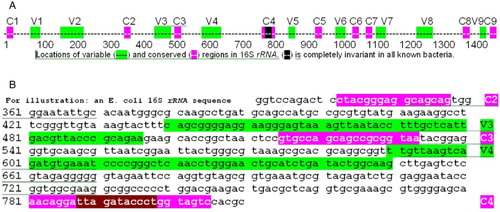
Table 1. Names and sequences of primers used in these experiments.
Figure 2. Example of the primer structure. A) Example of structure of primer containing anchor sequence (blue), spacer, index sequence (green), and 16S specific primer (red). Specifically, this is the sequence of primer C2X, which has the C2 forward sequence, an index, and an anchor sequence for anchor X. B) Cartoon of resultant DNA amplified with primers C2X and C4Y. The conserved regions of this amplicon (C2, C3, and C4) are shown in red. Arrows under the cartoon indicate the location and direction that specific primers would initiate sequencing. C) Cartoon illustrates direction of sequencing with 3 primers, for DNA anchored with Y adapter.

Table 2. Expected sequences in cycles 1 – 10 of samples selected for sequencing.
Figure 3. PCR products amplified by complex primers. 16S rRNA gene PCR products amplified by complex primers, having anchor, index, and primer sequence, from many species. Primers were either C2X with C4Y or C2Y with C4X, as indicated. The C2Y/C4X reaction for Sp.01 failed for unknown reasons. Abbreviations: W: water control; Sp: S. pyogenes; Ec: E. coli; Bac: B. fragilis; Dsv: D. vulgaris.
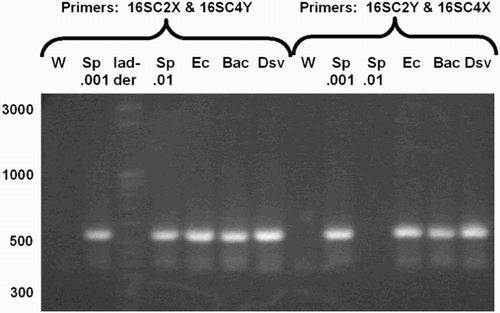
Figure 4. Sequence Basecall graphic summaries. Sequence information from the Percent Basecall graphic summaries of the Illumina analysis pipeline for cycles 1 – 10 for three lanes for which the basecalls (‘Illumina data’) matched the species-specific sequence expected in that lane (‘Expected’ for lane 3, S. pyogenes; lane 4, E. coli; and lane 8, D. vulgaris, based on sequences in Genbank). Basecall colors are: A, gray; C, red; G, blue; and T, green. For lane 3, the ‘Illumina data’ basecalls are listed after subtracting the high baseline error rate for ‘C’ and ‘A’ (see text).
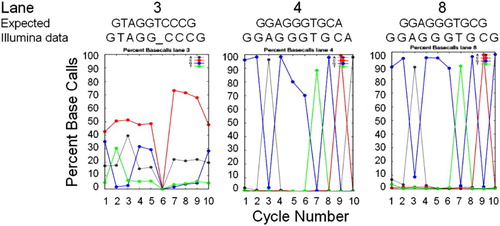
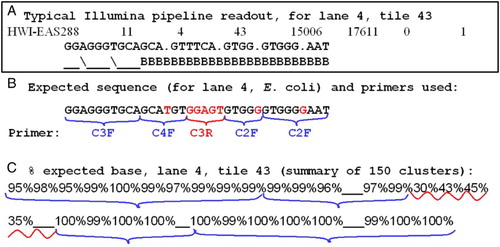
Figure 5. Accuracy of multiplex sequencing. Output and accuracy of Illumina 16S rRNA gene multiplex sequencing for a target of known sequence (Lane 4, E. coli). A) typical text output from the analysis pipeline, shown for one cluster of lane 4, tile 43. The sequence calls are followed by quality estimates using characters ‘_’, ‘B’, etc (see text). B) Expected sequence for E. coli, with the primers shown for their respective read cycles. Bases in black were called correctly > 95% of the time; in red, either not called or mostly incorrectly. C) Summary of the percent of correct calls analyzed for 150 clusters from lane 4, tile 43. Brackets are the same as in (B).