Figures & data
Figure 1. Concentration-dependent effects of 2-ME2 on p53. T47D cells were plated for two d in medium (- phenol red) containing 10% fetal bovine serum (FBS) followed by culturing for six d in medium containing 5% DCC-FBS. Semi-confluent cells were treated with 1 nM – 10 µM 2-ME2 or 10 nM E2 for 24 h. Cellular extracts were prepared and subjected to protein quantitation, SDS-PAGE, and Western analyses as described in Materials and Methods. Lanes labeled Cw and Cs represent control lanes with cells grown in the absence of ligands in medium containing either 10% FBS or DCC-FBS, respectively. The relative intensities of p53 as compared to Cs are displayed as the mean ± SEM. The sample sizes ranged from 3 - 15 integrated density measurements per group. *indicates significant difference with the control at p < 0.05 (Kruskal-Wallis Test followed by post-hoc analysis using Mann-Whitney U-Test). Representative Western blot is shown.
Figure 2. Effects of 2-ME2 on T47D cell proliferation. T47D cells were seeded at 15,000 cells/well in 12 well growth plates for two d in medium (- phenol red) containing 10% FBS followed by culturing for six d in medium containing 5% DCC-FBS supplemented with 1 nM – 10 µM 2-ME2 or 10 nM E2. Control and treatment medium was changed every 48 h. Cells were trypsinized and counted by Coulter Counter (model # Z2) after six d of treatment. Mean cell populations ( ± SEM) were plotted as a percentage of Cs with 100% on the ordinate scale representing cells cultured in the absence of ligands (
= 2.1 × 10⁵ cells/well). The sample sizes ranged from 8-20 cell counts per group. *indicates significant difference with the control at p < 0.05 (Kruskal-Wallis Test followed by post-hoc analysis using Mann-Whitney U-Test).
Figure 3. The effects of 2-ME2, E2, and Taxol on p53 protein. Culture and treatment of T47D cells with 2-ME2, E2, and taxol was performed as described in Figure 1. Cellular extracts were prepared and subjected to protein quantitation, SDS-PAGE and Western analyses. The relative intensities of p53 as compared to control (Cs) are displayed as the mean ± SEM. The sample sizes ranged from 3 - 15 density measurements per group. *indicates significant difference with the control at p < 0.05 (Kruskal-Wallis Test followed by post-hoc analysis using Mann-Whitney U-Test). Representative Western blot is shown.
Figure 4. The effects of 2-ME2, E2, and Taxol on T47D cell proliferation. Cells were seeded into 12 well growth plates in medium containing 10% FBS at a density of 20,000 cells/well followed by culturing for 6 d in media that contained 5% DCC-stripped FBS and 2-ME2, E2, or taxol, either alone or in combination. Control and treatment media was changed every 48 h. Cells were trypsinized and counted by Coulter Counter (model # Z2) after six d of treatment. Mean cell populations ( ± SEM, n = 6) were plotted as a percentage of control cells with 100% on the ordinate scale representing cells cultured in the absence of ligands (
= 3.2 x 10⁵ cells/well). *indicates significant difference between treatment and control at p < 0.05 (Kruskal-Wallis Test followed by post-hoc analysis using Mann-Whitney U-Test).
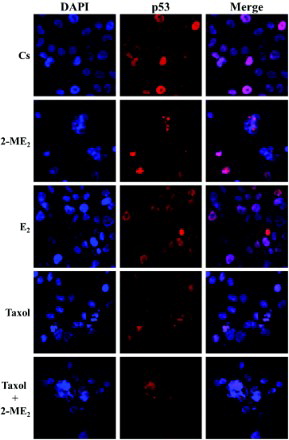
Figure 5. Immunolocalization of p53 in T47D cells: the effects of 2-ME2, E2, and Taxol. Cells were seeded at 15,000 cells/well on coverslips in 12 well growth plates for two d in medium containing 10% FBS, followed by culturing for six d in medium containing 5% DCC-stripped FBS. Cells were treated with 10 nM 2-ME2, 10 nM E2, and/or 1 µM taxol for 24 h. Localization of p53 was determined by immunolabeling and the distribution was analyzed using a Nikon Digital Eclipse C1 plus modular confocal microscope. DAPI (blue) and Cy3 were employed to detect the immunolocalization of p53 (red). The acquired images were processed using Nikon Elements AR software. The merged images illustrate localization of p53 relative to DAPI nuclear counterstain.