Figures & data
Table 1. Genotype-phenotype association of partial AZF deletions.
Figure 1. Examples of real-time HRM analysis results. The figure shows an example of duplex-PCR for SY1191 and SY1291. The red curve represents a subject with SY1191 deletion, while the blue curve represents a subject with SY129 deletion. The black curve represents the NTC. All the green curves represent subjects without any deletions. HRM: high resolution melt; NTC: non-template control.
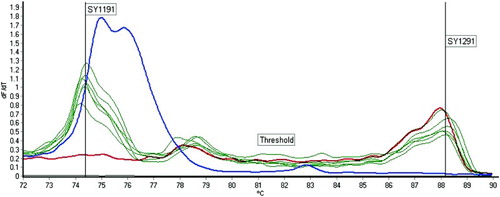
Figure 2. Normalized graph that was done to confirm the results of partial AZFc deletions. The red curve represents a sample with SY1191 deletion, the orange curve represents a sample with SY1291 deletion, the blue curves represent samples without deletions and the green curve represents the NTC. Note that the differences in the shapes of the curves confirm the deletions. NTC: non-template control.
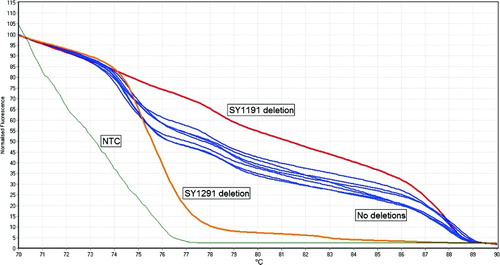
Figure 3. An example of duplex-PCR gel-electrophoresis for SY1191 and SY1291. Lane 3 had DNA of a subject with SY1191 deletion, while lane 4 had DNA of a subject with SY1291 deletion. Lanes 1 and 2 had DNA of subjects without deletions.
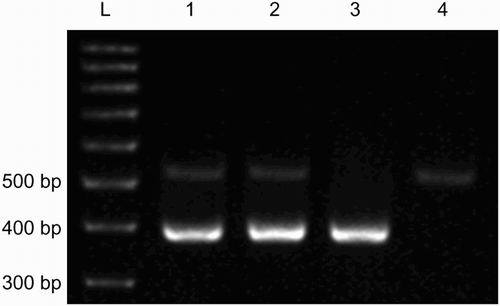
Table 2. List of the STSs that were used to screen for partial AZFc deletions with their primer concentrations, calculated melting temperatures, and calculated descriptive statistics.
Figure 4. Y-chromosome STR in 17 STR loci for each sample analysis using GeneMapper ID software and showing the number of repeats for each STR locus. STR: short tandem repeat.
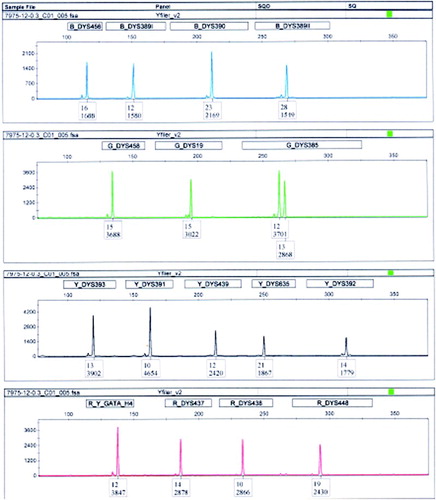
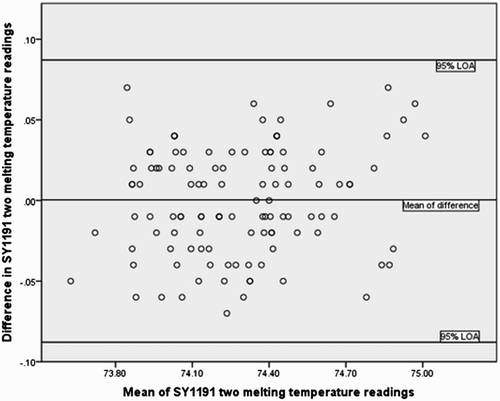
Figure 5. Limits of agreement (LOA) plot showing intra-individual differences (n = 115) between melting temperature readings of SY1191 on test and retest plotted against the mean of the temperature readings.