Figures & data
Table 1. Various parameters observed through semen analysis.
Figure 1. Presenting gross morphology pictures of testis and epididymis and their corresponding ultrasound images taken from various experimental groups. A–C) shows the morphology of testis and epididymis in sham-control, short-term and long-term animals, respectively. Arrow indicates the impression of epididymis on the testis. D) shows the ultrasound images of scrotal content. D–F and G–I) are images along longitudinal and transverse plains, respectively. Arrow and arrow head (red) in H indicates dilated mediastinum and epididymis, respectively. Arrow indicates dilated epididymis in I. T: testis; Ep: epididymis; V: vas deferens.
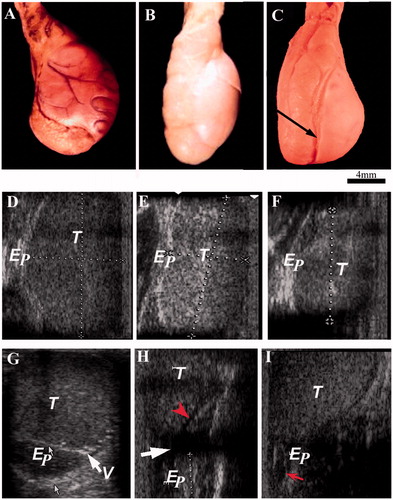
Table 2. Gross measurement of testis and epididymis.
Table 3. Estimation of testosterone and estradiol.
Figure 2. Photomicrograph of testis and epididymis stained with hematoxylin and eosin taken from various experimental groups. (A and B) shows the photomicrographs of testis (complete spermatogenesis - arrow) and epididymis (sperm accumulation - arrowhead) from sham-operated control. (C and D) are testis from short-term, and (E and F) are from long-term of unoperated and operated sides testes, respectively. The arrows in D and F indicate sites of germ cell leakage and hypertrophic changes in the interstitium. The arrowhead indicates depleted epithelium (F). (G) shows a seminiferous tubule taken from long-term animal with multinucleated giant cells, a large cell with multiple nucleuses with vacuole (arrow), and another cell with interconnected four distinct nucleuses (arrowhead). (H) a site of infiltration or inflammatory reaction around a capillary (vacuities like change) in epididymal interstitium from long-term animal was shown (arrow). Scale bar = 80 µm.
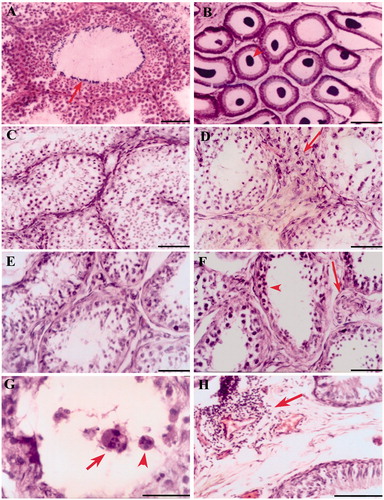
Figure 3. Fluorescent microscopic image of immunohistological staining of testis sections demonstrating deposition of anti-Monkey immunoglobulin (IgG)-FITC after vasectomy. (A) shamcontrol; (B) unoperated testes; and (C) operated testes. Arrow heads indicate the IgG deposition in the basal compartment of the seminiferous epithelium. In all testes IgG deposition was restricted to the basal compartment of the seminiferous tubules and not elsewhere. In unilateral vasectomized animals, the immunoglobulin depositions were seen in both operated and unoperated testes. However, the quantum of deposition in the unoperated side was not as severe as in the operated side. Scale bar = 80 µm.
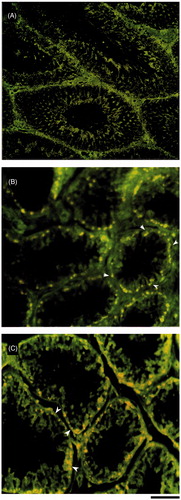
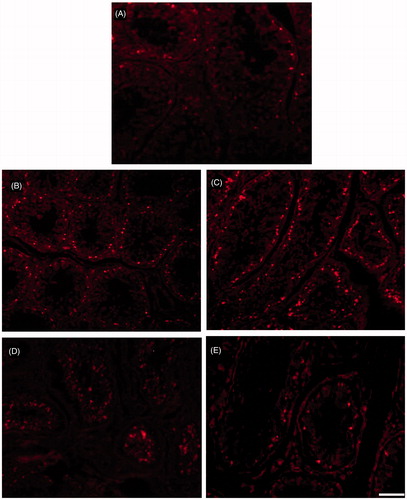
Figure 4. Photomicrograph of fluorescent microscopic images of TUNEL apoptotic positive cells (TMR red) in testis from various experimental groups. TUNEL positive cells (bright fluorescent spots) in seminiferous epithelium of the testis. (A–E) from sham-control, unoperated and operated side short-term testes, and unoperated and operated side long-term testes, respectively. The number of apoptotic cells identified by TUNEL was greater in seminiferous epithelium of both short and long-term bilateral and unilateral vasectomized animals when compared to the control. When compare to long-term testis short-term testis shows more apoptotic positive cells. Scale bar = 80 µm.