Figures & data
Table 1. The mean body, testis, and peri-testicular adipose tissue (PTAT) weight (g), testis volume (cm3), and mean volume of the seminiferous tubules (mm3) in all groups.
Figure 1. The sperm smears belonging to non-obese control (A), obese control (B), non-obese thymoquinone (C), and obese thymoquinone (D) groups are shown. Arrowheads: normal sperm morphology; double arrowheads: Dag effect; white filled arrow: tail-less sperm; black arrow: sperms with head and tail anomaly. The general morphology of sperms is seen in the all groups. Tail-less sperms, sperms with head and tail anomalies and also Dag effect are seen in the sperm smears of the OC group. But following TQ application, sperms having normal morphology are seen in the sperm smears of the OT group. Dye: HE; Scale Bars: 25 µm.
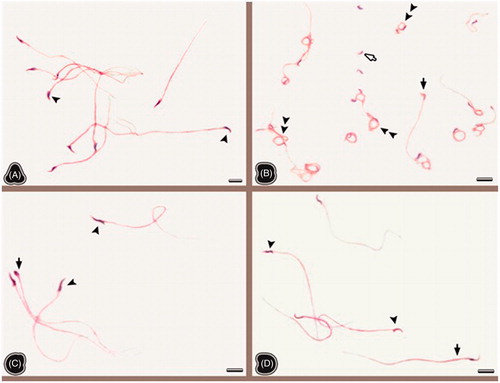
Table 2. The percentage of sperm with normal morphology or head, neck, and tail anomaly in all groups.
Figure 2. The light microscopical sections of testis belonging to the non-obese control (A), obese control (B), non-obese thymoquinone (C), and obese thymoquinone (D) groups are shown. Sg: spermatogonia, Sc: sertoli cell, Sd: Spermatid, St: spermatocyte, Ly: Leydig cell, My: myoid cell, P: pericytes, L: tubule lumen. (A) Arrow: negative staining of Sertoli cell. (C) Art: arteriole, Arrowhead: vessel wall. Histological structure of testis is seen in the all groups. Luteinizing hormone (LH) receptor positivity is shown by immunohistochemistry in the nuclei of the positive stained cells (signed). LH receptor activity was observed in the cells occupying the connective tissue and vascular walls rather than tubular and Leydig cells of the obese control group. But following thymoquinone application, more positive cells were seen in the light microscopical sections of the obese thymoquinone group. Dye: anti-LH/choriogonadotrophic hormone (CG) receptor immune stain; Scale Bars: 25 µm.
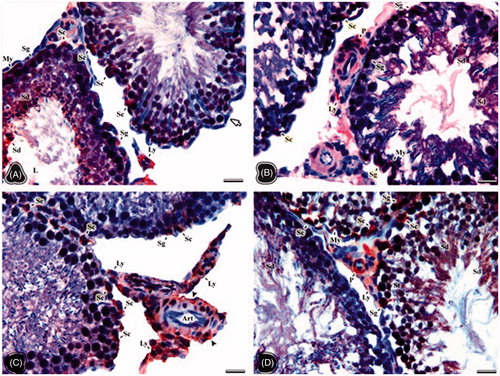
Table 3. The total number (×106) of the different cell types of the testis seen in the all groups.
Table 4. The values of catalase (CAT) and myeloperoxidase (MPO) enzyme activity in all groups.
Figure 3. The light microscopical sections of testis belonging to non-obese control (NC) and obese control (OC) groups are shown. (A and B) The light microscopical sections of testis belonging to the NC group. ST: seminiferous tubules, Black arrow: Tunica albuginea, Int: interstitial area, Fb: fibroblast, Ly: Leydig cell, M: macrophage, Framed area: spermatogenic cell series, Sg: spermatogonia, St: spermatocytes, Sd: spermatid, Sz: spermatozoon. (C and D) The light microscopical sections of testis belonging to the OC group. The stars show atrophic seminiferous tubules, asterisks show degenerated spermatogenic cell series, Arrowheads: the thin seminiferous tubule wall, e: enlarged peritubular tissue, Arrows: no spermatogenic cells within tubule epithelium, Art: arteriole. Histological structure of testis is seen in the NC and OC groups. In the OC group degenerations in the seminiferous tubules, enlarged peritubular tissue, and tubular atrophy are important findings. Dye: HE; Scale Bars: (A–C) 250 µm; (B–D) 25 µm.
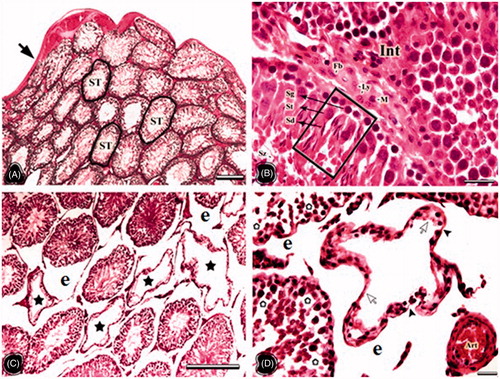
Figure 4. The light microscopical sections of testis belonging to the non-obese thymoquinone (NT) and obese thymoquinone (OT) groups are shown. (A and B) The light microscopical sections of testis belonging to the NT group. Star: intensive sperm in the tubule lumen, Sd: intensive spermatid in the tubule lumen, Int: interstitial area. (C and D) The light microscopical sections of testis belonging to the OT group. Arrowhead: tunica albuginea, e: enlarged peritubular tissue, arrows: germ cell loss. Framed area of C was indicated in D at higher magnification. Histological structure of testis is seen in the NT and OT groups. In the NT group more spermatogenic cells were seen on the seminiferous tubule walls compared to those of the NC group. Degenerated cells were decreased and no atrophic tubules were seen in OT group. Dye: HE; Scale Bars: (B–D) 25 µm; (A–C) 150 µm.
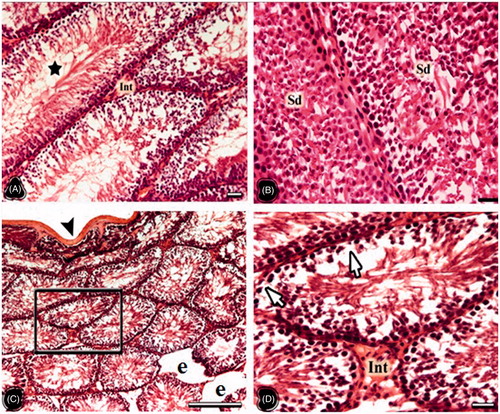
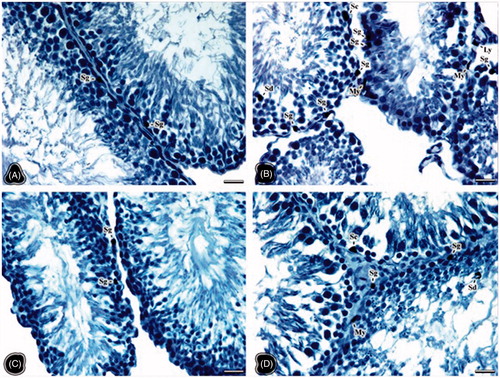
Figure 5. The light microscopical sections of testis belonging to the non-obese control (A), obese control (B), non-obese thymoquinone (C), and obese thymoquinone (D) groups are shown. Sg: spermatogonia, Sc: sertoli cell, Sd: spermatid, St: spermatocyte, Ly: Leydig cell, My: Myoid cell. Histological structure of testis is seen in all groups. Apoptotic activity is shown by TUNEL method in the nuclei of the positive stained cells (signed). The most apoptotic cells are seen in the OC group. But following TQ application, less apoptotic cells are seen in the light microscopical sections of the OT group. Dye: TUNEL stain; Scale Bars: 25 µm.