
Figures & data
Table 1. Body weight and composition of vervet monkeys at baseline and post-dietary intervention at 10 months.
Figure 1. Menstrual cycle length in days for baseline cycles (cycle #1-10) and cycles during dietary intervention (cycles #11-24). Arrows indicate the timing of CL collection for each monkey during the baseline and post-dietary intervention (post-int.) cycles.
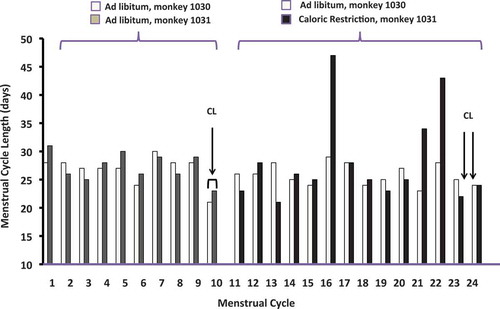
Table 2. Serum hormone levels drawn during the mid-luteal phase four cycles after the baseline CL biopsy and on the day of post-intervention CL collection.
Figure 2. Dendrogram and unsupervised hierarchical clustering of the array data. Data from differentially expressed mRNA transcripts showing a 3-fold or greater change in expression for the monkey 1030 and a 2-fold or greater change in expression for the monkey 1031. The top dendrogram shows the relationship between the samples based on gene expression patterns. Hierarchical clustering indicates that the CL transcriptome after weight gain shows the greatest number of expression changes compared to the other CL transcriptomes. The expression intensity of each gene varies from red (high) to green (low).
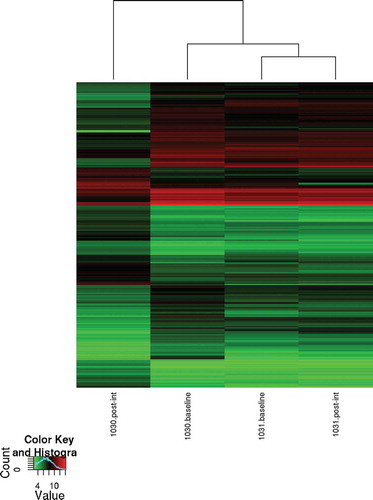
Table 3. Differentially expressed gene transcripts regulate corpus luteum hormone biosynthesis and lutenized granulosa cell survival after weight gain.
Figure 3. Molecular and cellular functions enriched in corpus luteums (CLs) after dietary intervention compared to CL at baseline. (A) Molecular and cellular functions enriched among the downregulated CL transcripts of the weight gain monkey. Transcript regulating lipid transport and metabolism are downregulated in CL after weight gain. Suppression of small molecular biochemistry involved functions related to steroid hormone biosynthesis. Also, growth and proliferation of endothelial cells is suppressed in CL after weight gain. (B) Molecular and cellular functions enriched among the upregulated CL transcripts of the weight loss monkey. Function related cell cycle regulation and mitosis are upregulated in the CL after weight loss. Threshold indicates right-tailed Fisher exact test p=0.05.
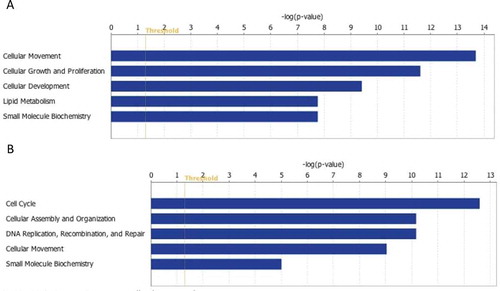
Figure 4. Quantitative real-time PCR confirms array data for select transcripts. Real-time primers were designed using vervet genomic sequences. All samples were normalized to the housekeeping genes, GAPDH and β-actin. Data shown indicates the relative expression of the post-intervention CL sample with respect to the pre-intervention sample for each transcript from microarray (gray bar) and qrtPCR (black bar). (A) Data for the weight gain vervet monkey and (B) for the weight loss vervet monkey.
Figure 5. Schematic of the proposed impact of increased adiposity on CL function. After weight gain the mid-luteal vervet CL showed decreased expression of the genes involved in P4 steroidogenesis, cholesterol transport, angiogenesis, and luteinized GC survival. In this model, we hypothesize that adiposity and associated lipotoxic changes impair normal cellular homeostasis of the CL, resulting in its premature functional regression and decreased P4 secretion. The exact mechanisms by which lipotoxicity leads to the CL dysfunction remains to be investigated. Reactive oxygen species may play a role in this process.
Table 4. Baseline characteristics of vervet monkeys.