Publication Cover
Mitochondrial DNA
The Journal of DNA Mapping, Sequencing, and Analysis
Volume 22, 2011 - Issue sup1: FishBol: The Fish Barcode of Life
2,709
Views
34
CrossRef citations to date
0
Altmetric
Full Length Research Paper

DNA barcoding of billfishes

, , , &
Pages 27-36 | Received 06 Oct 2010, Accepted 10 Jun 2011, Published online: 10 Oct 2011

Figures & data

Figure 1.  NJ tree of COI sequences. NJ analysis, carried out in MEGA using K2P distance, of all billfish COI barcode sequences included this study. The full tree of 353 sequences is included in Supplementary Online Material. Multiple sequences are collapsed to triangles in which vertical distance corresponds to the number of sequences, and horizontal distance is proportional to sequence diversity. Numbers indicate the number of individual specimens in a species. Several internal branches were collapsed to polytomies to indicate low bootstrap support for the same nodes in a maximum parsimony analysis—see supplementary online material. Images are taken from the FAO ‘Billfishes of the World’ catalog (CitationNakamura 1985) and are used with the permission of the copyright holder.
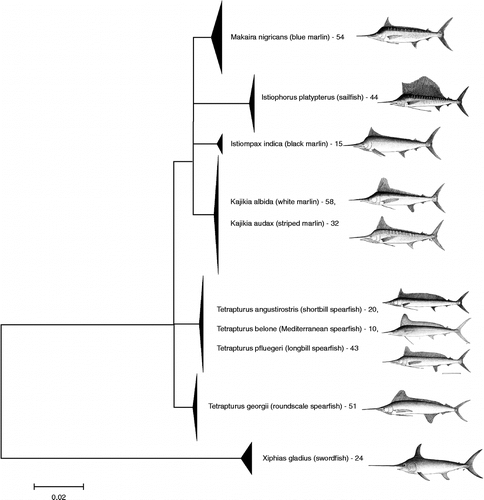
Figure 1.  NJ tree of COI sequences. NJ analysis, carried out in MEGA using K2P distance, of all billfish COI barcode sequences included this study. The full tree of 353 sequences is included in Supplementary Online Material. Multiple sequences are collapsed to triangles in which vertical distance corresponds to the number of sequences, and horizontal distance is proportional to sequence diversity. Numbers indicate the number of individual specimens in a species. Several internal branches were collapsed to polytomies to indicate low bootstrap support for the same nodes in a maximum parsimony analysis—see supplementary online material. Images are taken from the FAO ‘Billfishes of the World’ catalog (CitationNakamura 1985) and are used with the permission of the copyright holder.

Figure 2.  Haplotype parsimony network for white and striped marlin. Haplotype parsimony network, generated using the program TCS at the 99% connection limit, of 91 COI sequences belonging to the white marlin (K. albida) and striped marlin (K. audax). Individuals carrying the shared haplotype (square box) included six specimens of K. albida (EBFSF021-07, EBFSF025-07, EBFSF103-09, EBFSF115-09, MXII141-07, MXII138-07) and five of K. audax (EBFSF278-10, EBFSF280-10, EBFSF284-10, EBFSF289-10, EBFSF291-10).
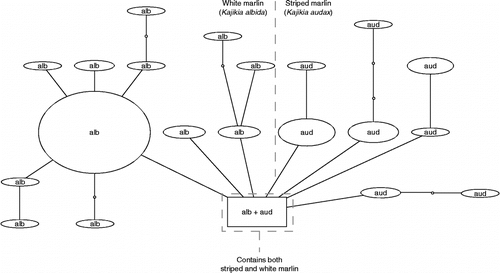
Figure 2.  Haplotype parsimony network for white and striped marlin. Haplotype parsimony network, generated using the program TCS at the 99% connection limit, of 91 COI sequences belonging to the white marlin (K. albida) and striped marlin (K. audax). Individuals carrying the shared haplotype (square box) included six specimens of K. albida (EBFSF021-07, EBFSF025-07, EBFSF103-09, EBFSF115-09, MXII141-07, MXII138-07) and five of K. audax (EBFSF278-10, EBFSF280-10, EBFSF284-10, EBFSF289-10, EBFSF291-10).

Figure 3.  Haplotype parsimony network for spearfishes. Haplotype parsimony network, generated using the program TCS at the 99% connection limit, of 64 COI sequences belonging to the spearfish species T. angustirostris, T. belone, and T. pfluegeri.
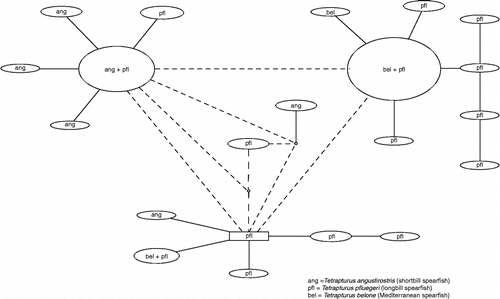
Figure 3.  Haplotype parsimony network for spearfishes. Haplotype parsimony network, generated using the program TCS at the 99% connection limit, of 64 COI sequences belonging to the spearfish species T. angustirostris, T. belone, and T. pfluegeri.

Figure 4.  NJ tree of mtCR sequences. NJ analysis, carried out in MEGA using K2P distance, of mtCR sequences, extracted from GenBank and originally from the studies by Graves and McDowell (Citation2006) and McDowell and Graves (Citation2008).
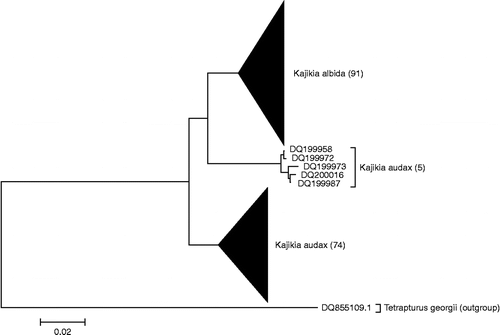
Figure 4.  NJ tree of mtCR sequences. NJ analysis, carried out in MEGA using K2P distance, of mtCR sequences, extracted from GenBank and originally from the studies by Graves and McDowell (Citation2006) and McDowell and Graves (Citation2008).

Figure 5.  NJ tree of rhodopsin sequences. NJ analysis of 72 nuclear rhodopsin (Rho) sequences, carried out using the BOLD Taxon ID Tree function, using K2P distance. Arrow indicates the four apparently heterozygous K. audax individuals.
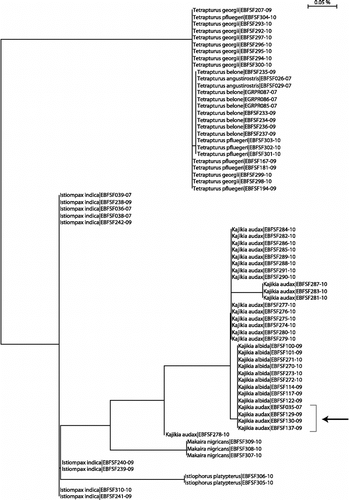
Figure 5.  NJ tree of rhodopsin sequences. NJ analysis of 72 nuclear rhodopsin (Rho) sequences, carried out using the BOLD Taxon ID Tree function, using K2P distance. Arrow indicates the four apparently heterozygous K. audax individuals.
Supplemental material

Supplementary Material

Download (236.8 KB)

Supplementary Material

Download JPEG Image (924.4 KB)

Supplementary Material

Download PDF (281.9 KB)

Supplementary Material

Download (34.7 KB)

Supplementary Material

Download MS Excel (99 KB)

Reprints and Corporate Permissions

Please note: Selecting permissions does not provide access to the full text of the article, please see our help page How do I view content?

To request a reprint or corporate permissions for this article, please click on the relevant link below:

Academic Permissions

Please note: Selecting permissions does not provide access to the full text of the article, please see our help page How do I view content?

Obtain permissions instantly via Rightslink by clicking on the button below:

If you are unable to obtain permissions via Rightslink, please complete and submit this Permissions form. For more information, please visit our Permissions help page.